Transforming data to logs
If you need log data for your analysis, you can either enter logs directly or transform your data. For example, you should fit a sigmoidal dose-response equation to data expressed with X as logarithm of dose. If you enter concentrations, you'll need to convert them to logarithms before using nonlinear regression.
To transform your data to logs:
Click the Analyze button, choose built-in analyses, and then select Transforms from the list of data manipulations. Choose X = log(X).
Also check the box at the bottom of the dialog to Create a New Graph of the results. Prism will create a results table of the transformed data, and a new graph. To perform nonlinear regression on the transformed data, click Analyze from either the results table or the new graph.
Plot data already entered as logarithms
If you enter data as logarithms, or graph the results of a log transform, you should graph the data with a linear axis. Don't choose a log scale! Your data are already logarithms. If your data represent logarithms, you can format the axis numbering to make this clear.

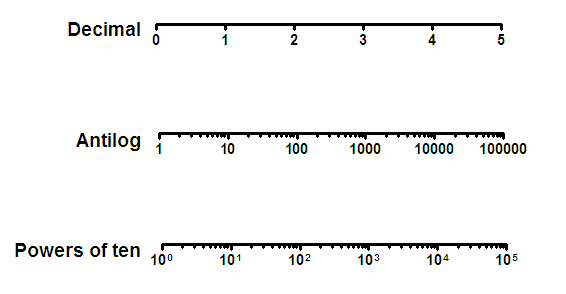
The figure below compares the appearance of decimal (the default), powers of ten, and antilog formatting.

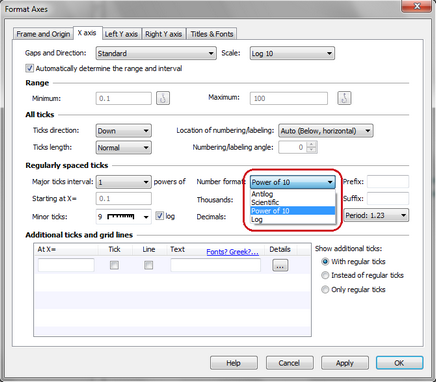
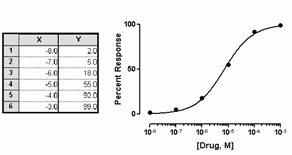
In the graph below, the X values represent the logarithm of concentration. The logs were entered directly into the X column of the data table. The graph of these data has a linear (not log) X axis. The axis was formatted with a numbering format of powers of 10, and with nine minor tick intervals with log spacing (see dialog settings below the graph).

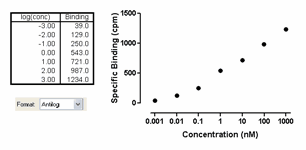
In the graph below, An alternative way to indicate that the data are logarithms is to choose the antilog numbering format (this choice is only available when the interval is 1, the minimum is –9 or greater, and the maximum is 9 or less).
