You can plot bars on Column, Grouped, Contingency, and XY graphs.
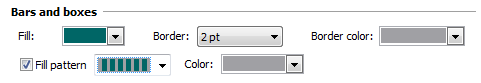
Formatting bars works a bit different than it did in prior Prism versions. By default, the bars are solidly filled with a color you choose, and have a border whose thickness and color you choose.
If you want a fill pattern, check the option box, then choose the design (the fill pattern) and color.