You can plot symbols on Column, Grouped, Contingency, and XY graphs.
Notes:
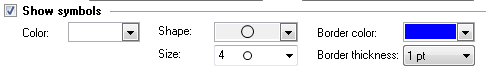
•You will only have choices of border color and thickness when you choose an open symbol (as shown above).
•The standard set of symbols will probably have what you want:
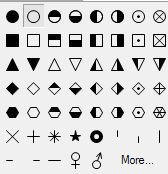
•If you click "More", you can choose any character from any font to use instead of a symbol.