Note: the Graph Inspector is currently only available for Multiple Variables graphs!
Customizing graphs is almost always an iterative process. You try different colors, line weights, patterns, and more and continuously combine them and remix them in different ways until you get just the right look for your final graph. With the release of Prism 10, an entirely new graph engine was introduced to create and customize graphs from Multiple Variables data. To take full advantage of this new graphing engine, the Graph Inspector was also introduced with Prism 10, and provides a new way of interacting with and customizing multiple variables graphs.

Instead of going through multi-tabbed dialogs to make a lot of choices and apply them all at once, the Graph Inspector lets you make changes in real-time! The new graphing engine for Multiple Variables graphs also provides a more tactile approach to data exploration, allowing you to select a single data point to highlight it and see its properties (from the table) in the Graph Inspector, or to click the same point again to select its corresponding group of points on the graph.
Can I quickly change the variables plotted on the graph?
Features and functionality described in this section are only available for subscriptions that use email-based named-user licenses. |
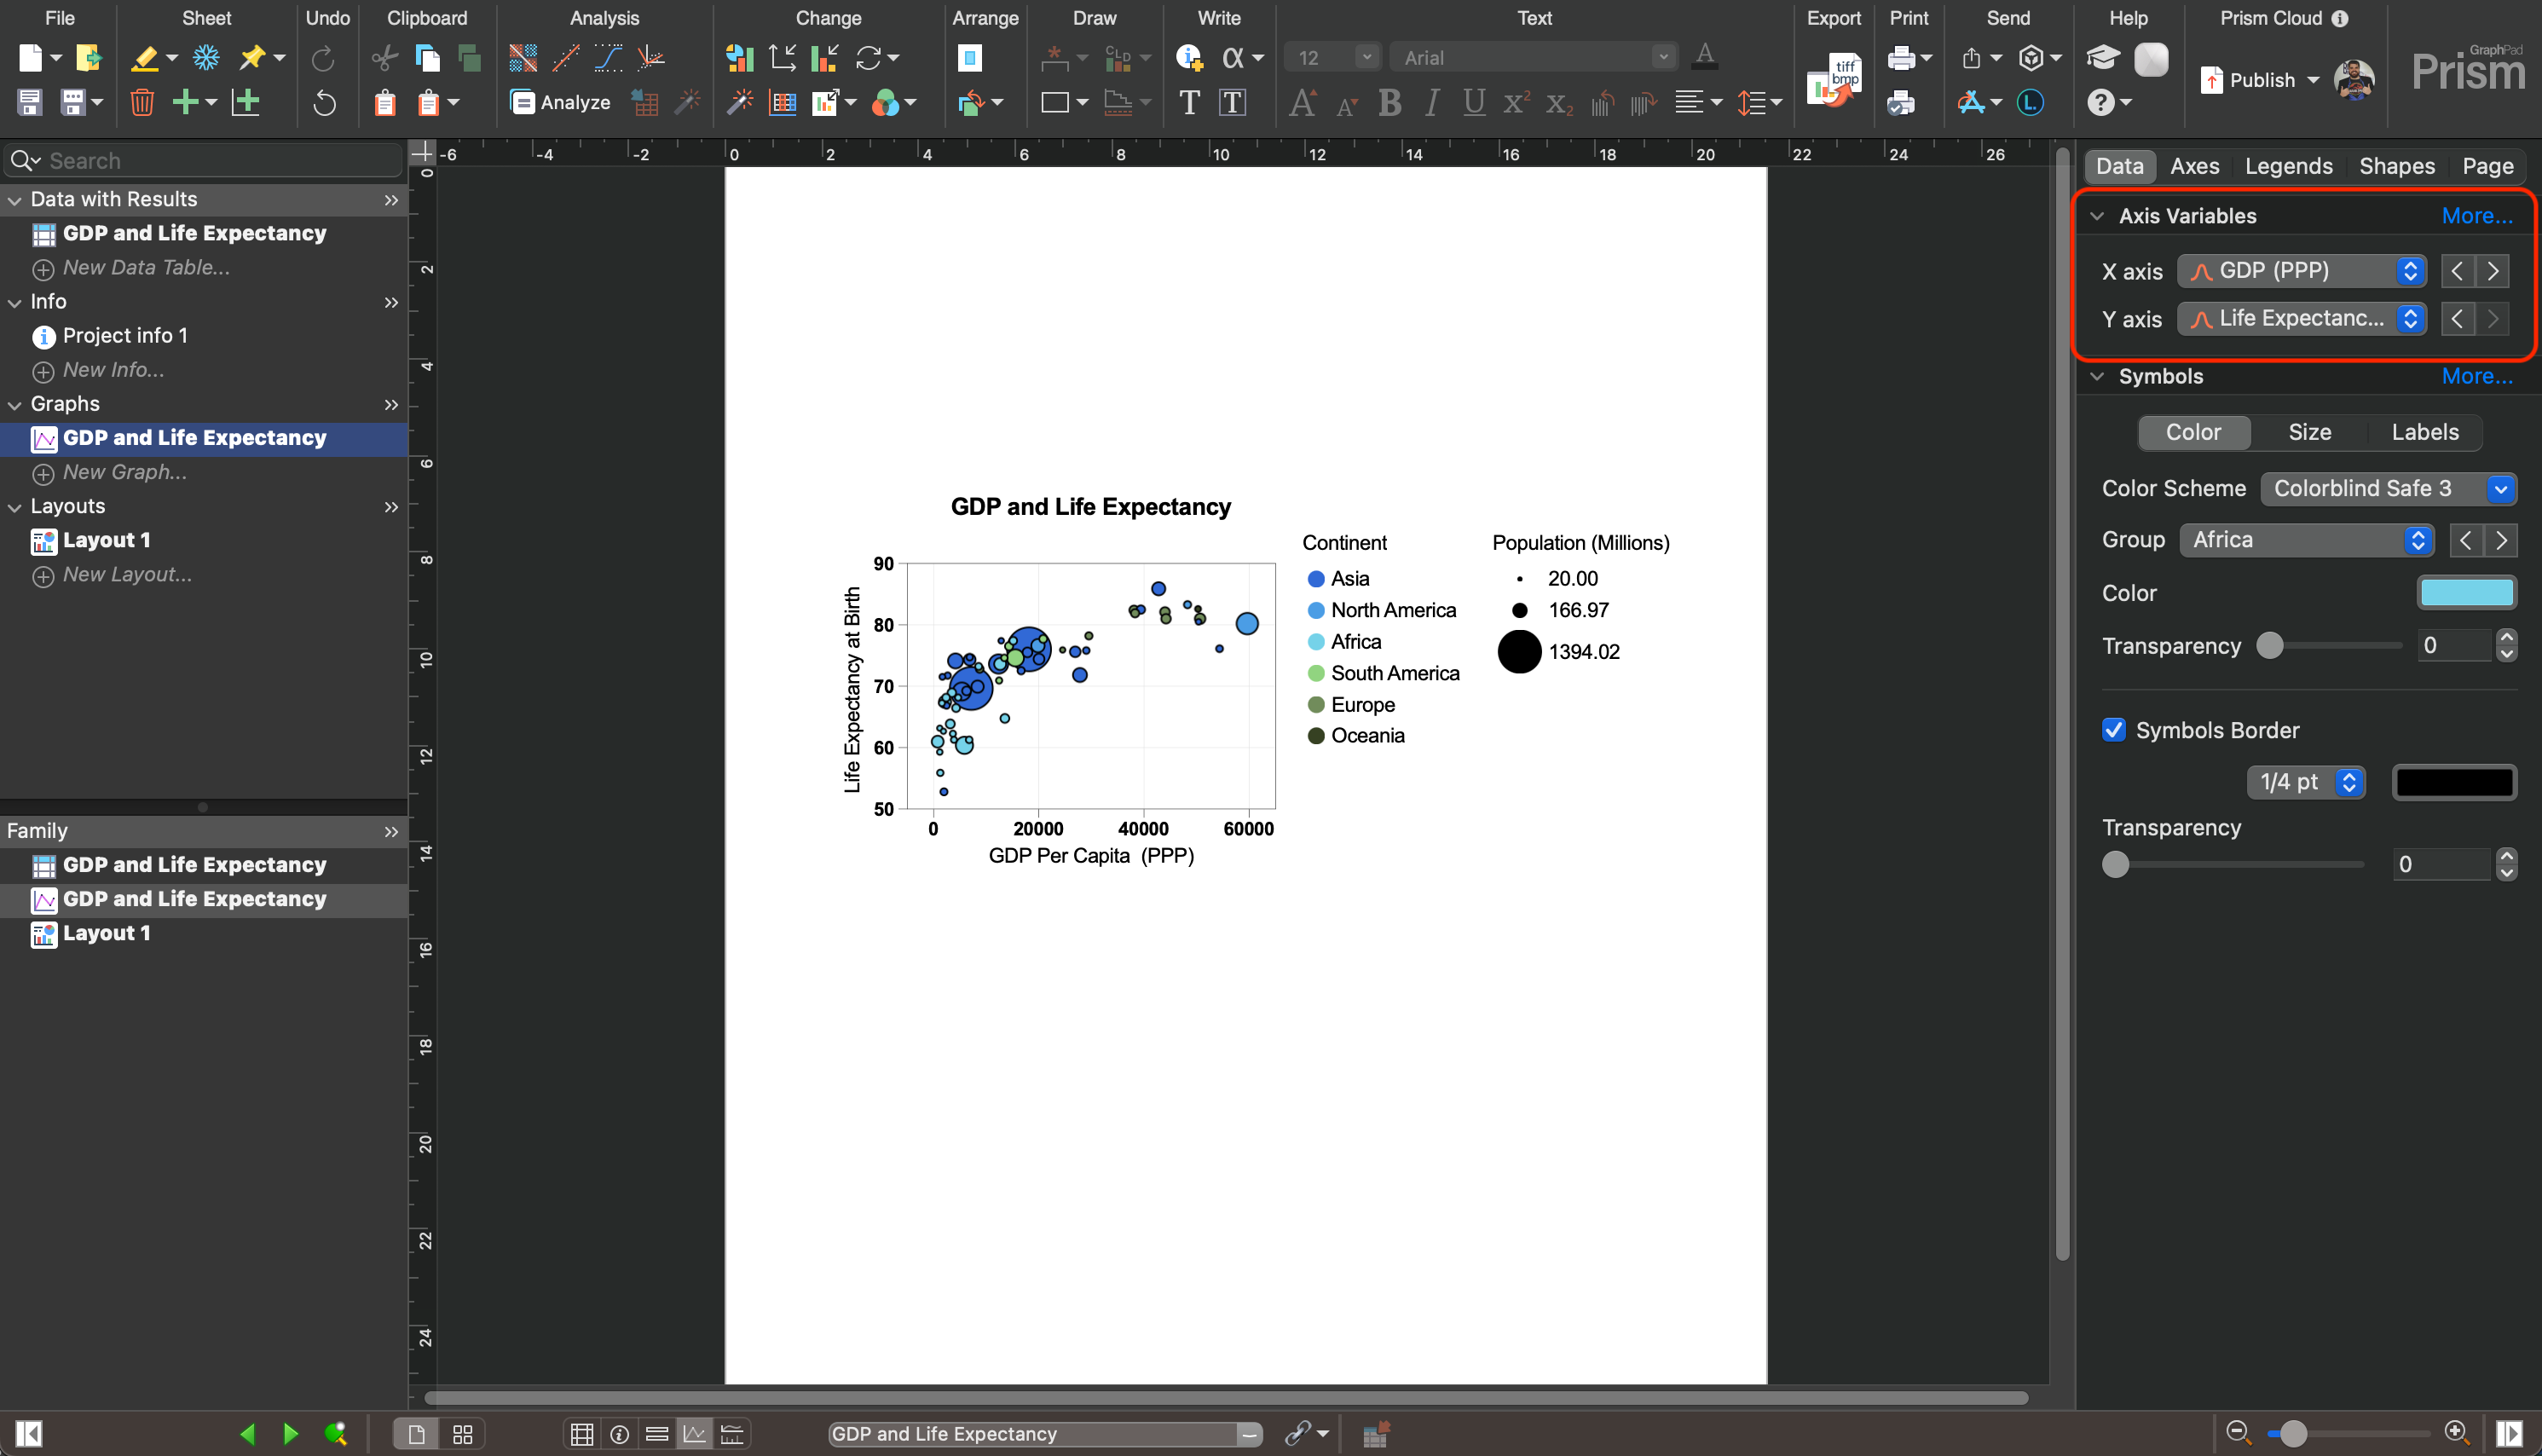
Yes! Starting in Prism 10.5 the data tab of the Graph Inspector now displays the variables assigned to the X and Y axes in dropdown menus. This allows you to quickly choose a specific set of variables to visualize, or to scroll through all relevant variables in the input data table to get a feel for the relationships between your variables.
What if I like using a separate dialog to format my graph
Not to worry! There's still a Format Graph dialog for Multiple Variables graphs that contains all of the controls you need get your visualization just right. And it's also been updated in Prism 10 to be easier to navigate and use!
How is the Graph Inspector Organized?
There are five main tabs of the Graph Inspector, each with their own set of options for customizing your graph:
1.Data
a.Axis variables
b.Symbols
i.Color
ii.Size
iii.Borders
iv.Labels
c.Lines
i.Color
ii.Thickness
iii.Pattern
iv.Style
2.Axes
a.Range and Interval
i.Minimum
ii.Maximum
iii.Interval
iv.Starting at
v.Minor ticks
vi.Scale
b.Title
i.Font controls
ii.Rotation (Y axis only)
iii.Location
iv.Border
v.Fill color
c.Numbers
i.Font controls
ii.Location
d.Line
i.Style
ii.Thickness
iii.Color
3.Legends
a.Color
b.Size
4.Shapes (for free drawn objects)
a.Fill color
b.Fill pattern
c.Border options
5.Page
a.Color scheme
b.Background color
c.Plotting area color
d.Display options
i.Graph title toggle
ii.X axis title toggle
iii.Y axis title toggle
iv.Color legend toggle
v.Size legend toggle