The choices on the Format Axis dialog are self-explanatory. Don't overlook the Additional Ticks and Grid lines section which lets you place any numbers or labels anywhere on any axis. And don't overlook the Frame and Origin tab.
Here is a list of shortcuts to change the axis directly, without using the Format Axes dialog:
•To change the shape and size of a graph by stretching: Click once on an axis to select it. Then drag on either end to stretch.
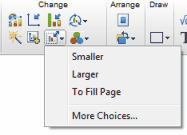
•To make a graph proportionately larger or smaller: Click Resize Graph button on the Change section of the Prism toolbar.
•To change the thickness or color of one axis: Click once to select that axis. Then click Change and choose Selected Object(s). If you change the X axis, the top part of the axis frame will also change accordingly. If you change the left Y axis, the right part of the axis frame will also change accordingly (unless you created a right Y axis).
•To move the graph and axis titles closer to, or further from, the graph: Position the mouse near the title until the cursor becomes a two-headed arrow. Then drag.
•To move the axis numbering (or labeling) closer to, or further from, the axis: Move the mouse over the numbering until the cursor becomes a two-headed arrow. Then drag. Or click once on the numbering to select. Then nudge one pixel at a time by clicking the arrow keys.
•Double-click on the origin of a graph to bring up the Frame and Origin tab of this dialog.
•To format the size, font, color, etc. of the numbering of an axis, click to select the axis and then use the controls in the Text toolbar.