There are three approaches to having horizontal error bars in Prism.
XY graphs with X error values
In the Welcome (File..New) dialog, or using Format Data Table, you can ask Prism to create a subcolumn for X error bars.
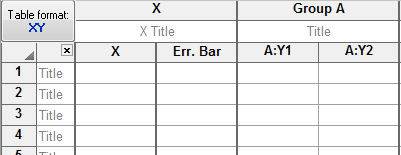
Prism will then plot each point with horizontal X error bars sticking in each direction a distance defined by the X error value you entered. It is not possible to tell Prism to only plot the error value in one direction.
Prism will only plot the horizontal error bars if you turn on plotting of the Y error bars too. Even if you have entered to replicates or error values for Y values, you need to tell Prism to plot the Y error bars in order for it to plot the X error bars. To do this, choose "Mean and error" in the appearance drop down in Format Graph, and "Mean and SEM" in the Plot dropdown.
Rotate Column or Grouped graphs so the Y axis is horizontal
A choice on the third tab of Format Graph, lets you flip any Column or Grouped graph so the Y axis is horizontal. If you plot symbols or bars with error bars, those error bars will now be horizontal, but that horizontal axis is now the Y axis.
Depth charts
When you place an XY graph on a layout, you can choose to have it rotated 90 degrees to create a depth chart. Error bars that are vertical on the graph will now be horizontal on the layout.