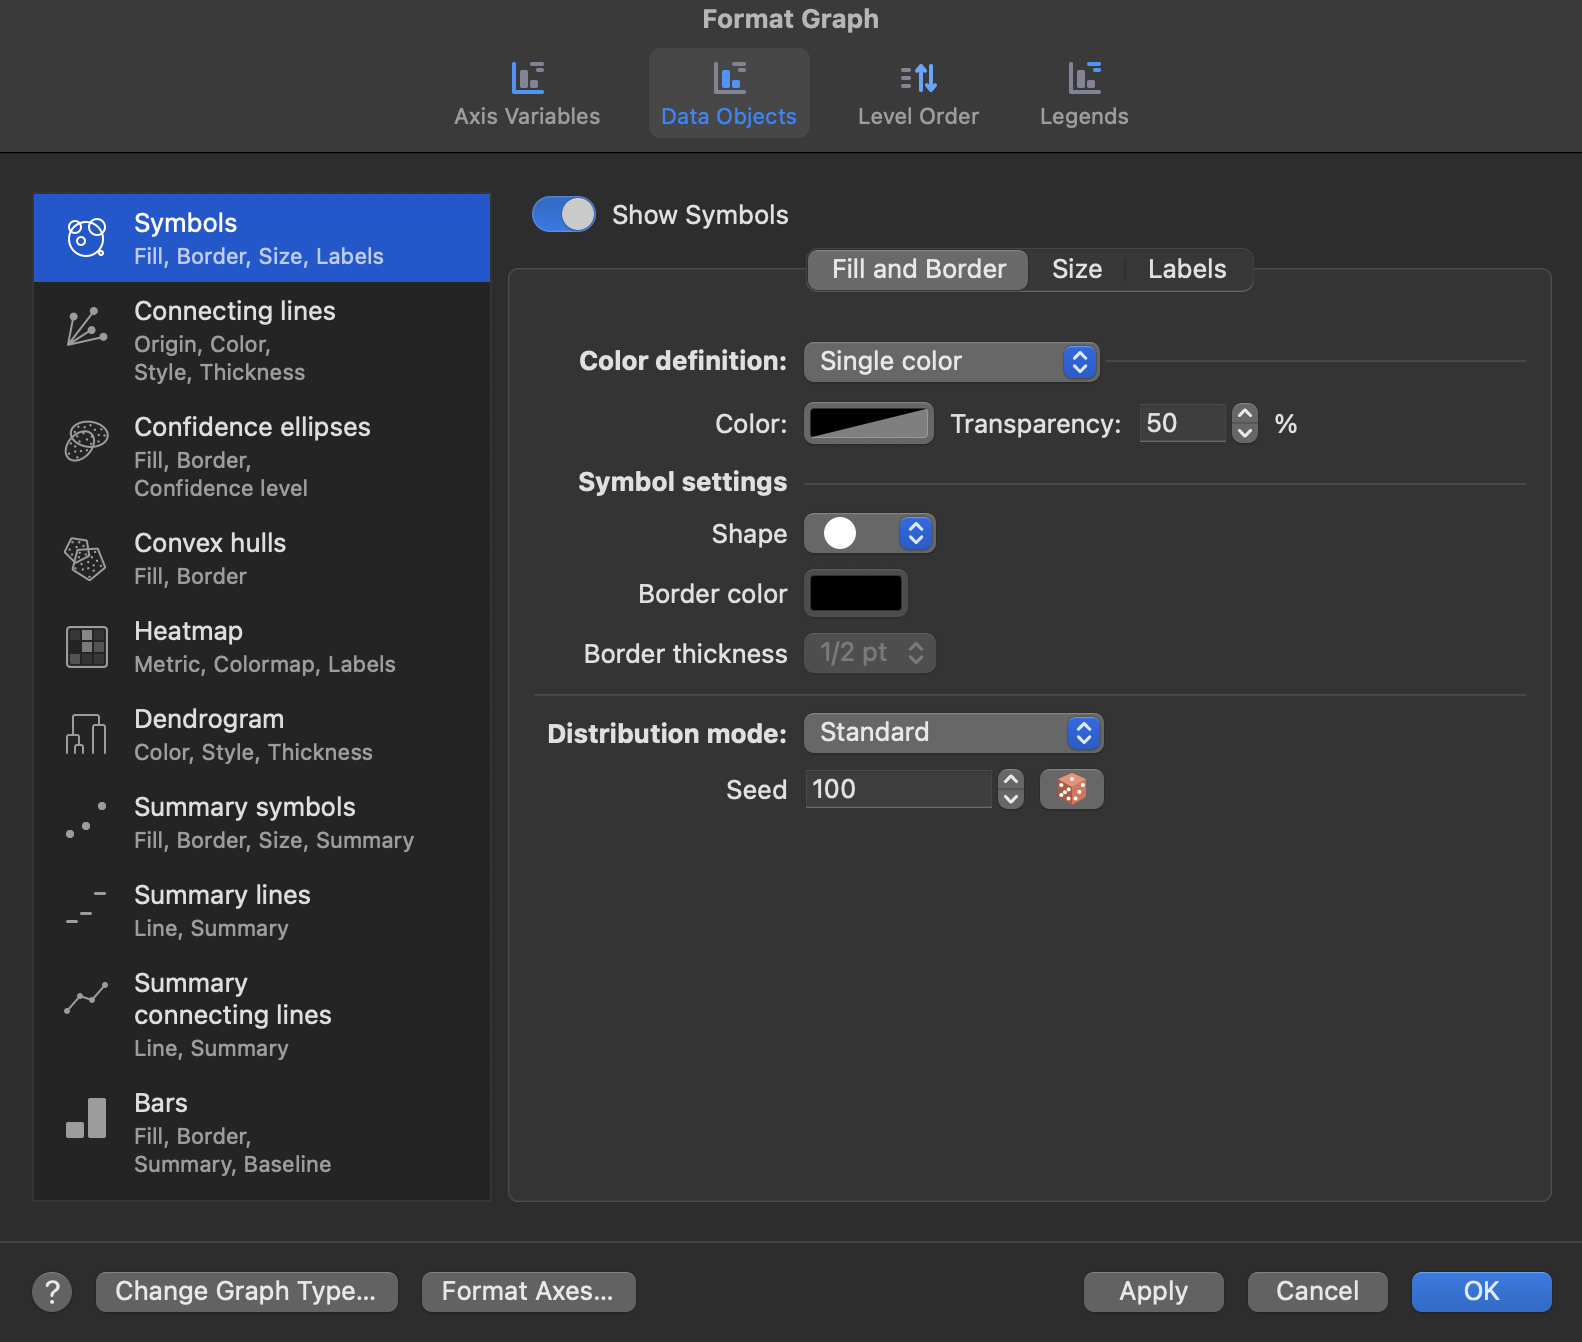
The Color definition options are the first set of controls on the Fill and Border tab of the Symbols Data Object. The other set of controls on this tab are for customizing symbol properties such as shape and Borders (details on a separate page).
The color definition dropdown menu allows you to specify how the symbol colors should be determined (either by defining a single color value or by selecting a variable from the input data table to use to define color values for the graph symbols).
Single color (for all symbols on the graph)
Select a color and transparency value that will be applied to ALL symbols plotted on the graph.
Variable
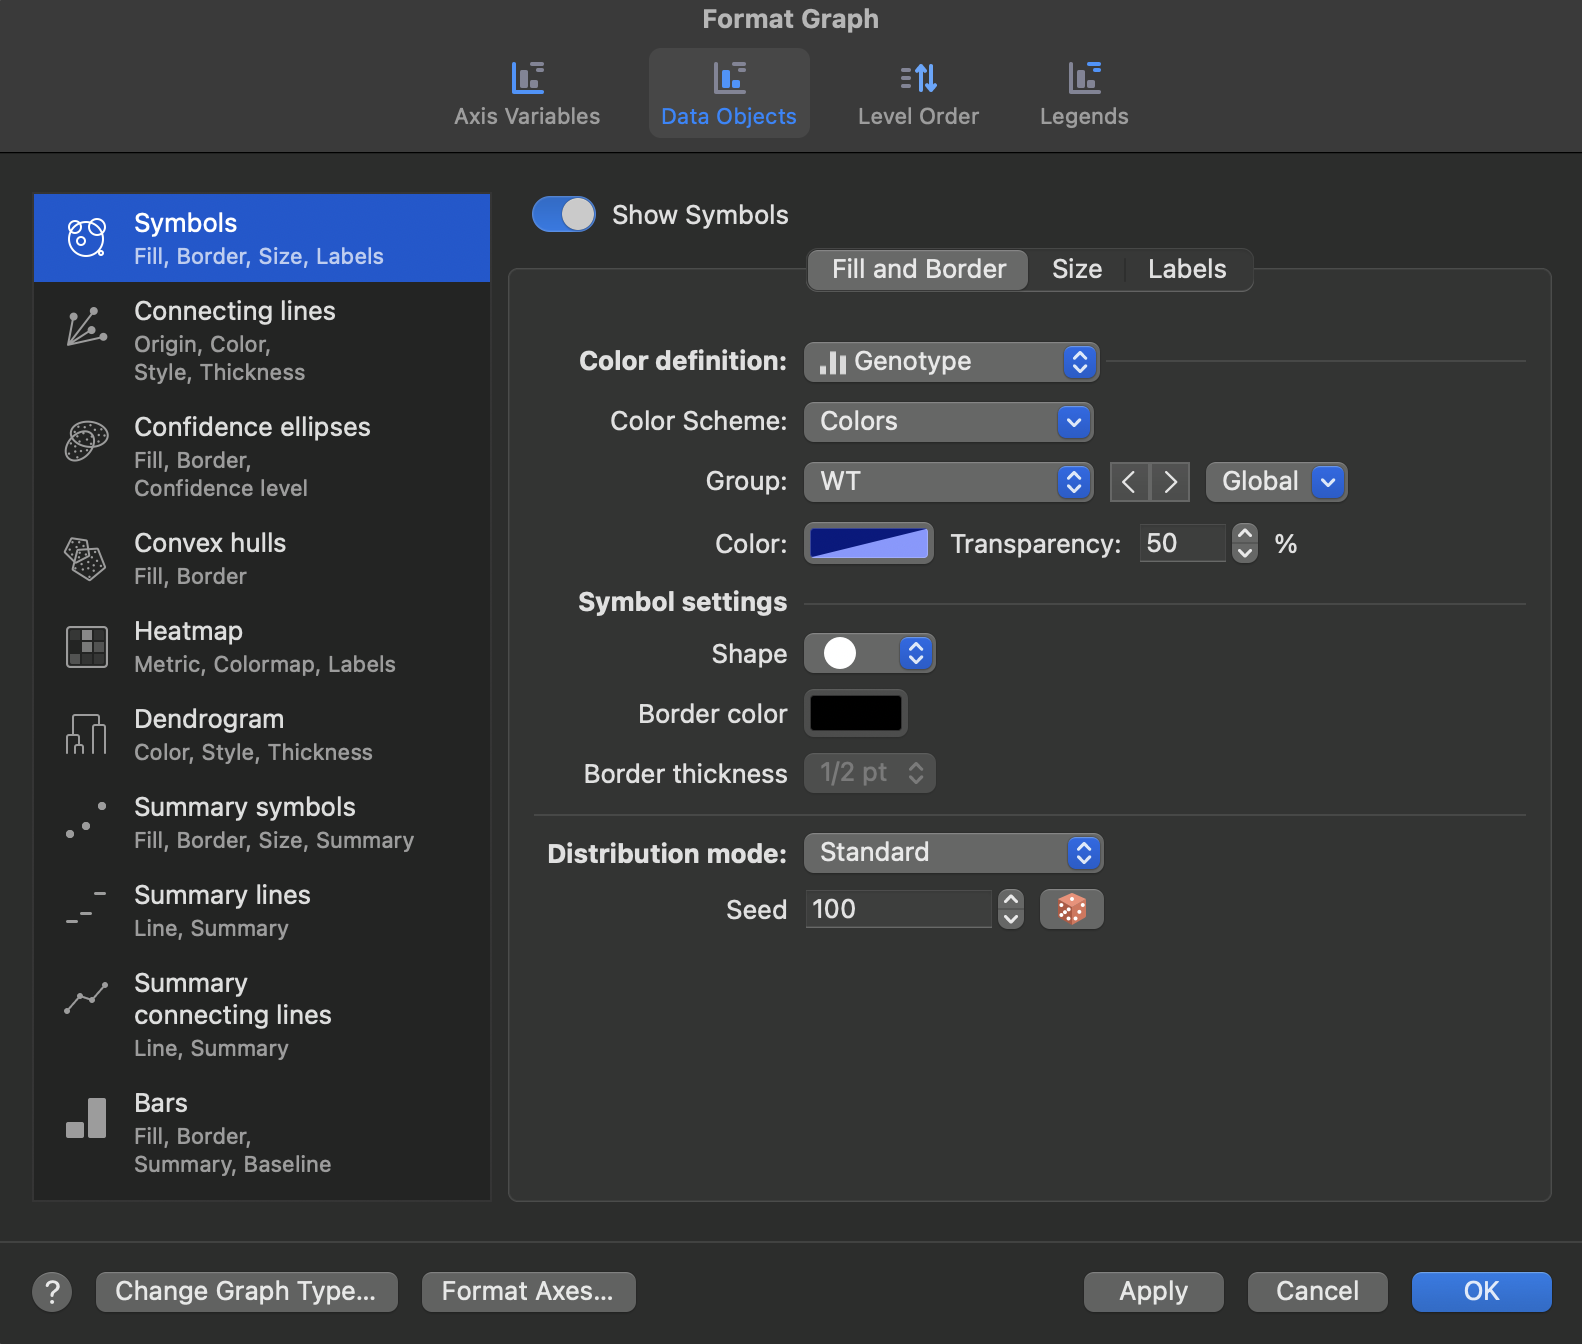
Select a variable to define symbol color on the graph. This variable can be either categorical or continuous.
Categorical Variable
If choosing a categorical variable, each level of the selected categorical variable will be treated as its own group, and can be assigned its own Color and Transparency level. Additionally, multiple groups (multiple levels of the selected categorical variable) can be selected at once using the Global dropdown menu.
Continuous Variable
If choosing a continuous variable, a colormap must be chosen from the Colormap dropdown menu. You can choose from the built-in colormaps, or define your own using the “Single Gradient” or “Double Gradient” options in the Colormap dropdown menu. Each of these colormaps defines a continuous range of colors, and the color of each symbol on the graph will be determined by its value for the continuous variable assigned in the Variable dropdown menu. This process of color assignment is similar to what you may have seen in Heat Maps.
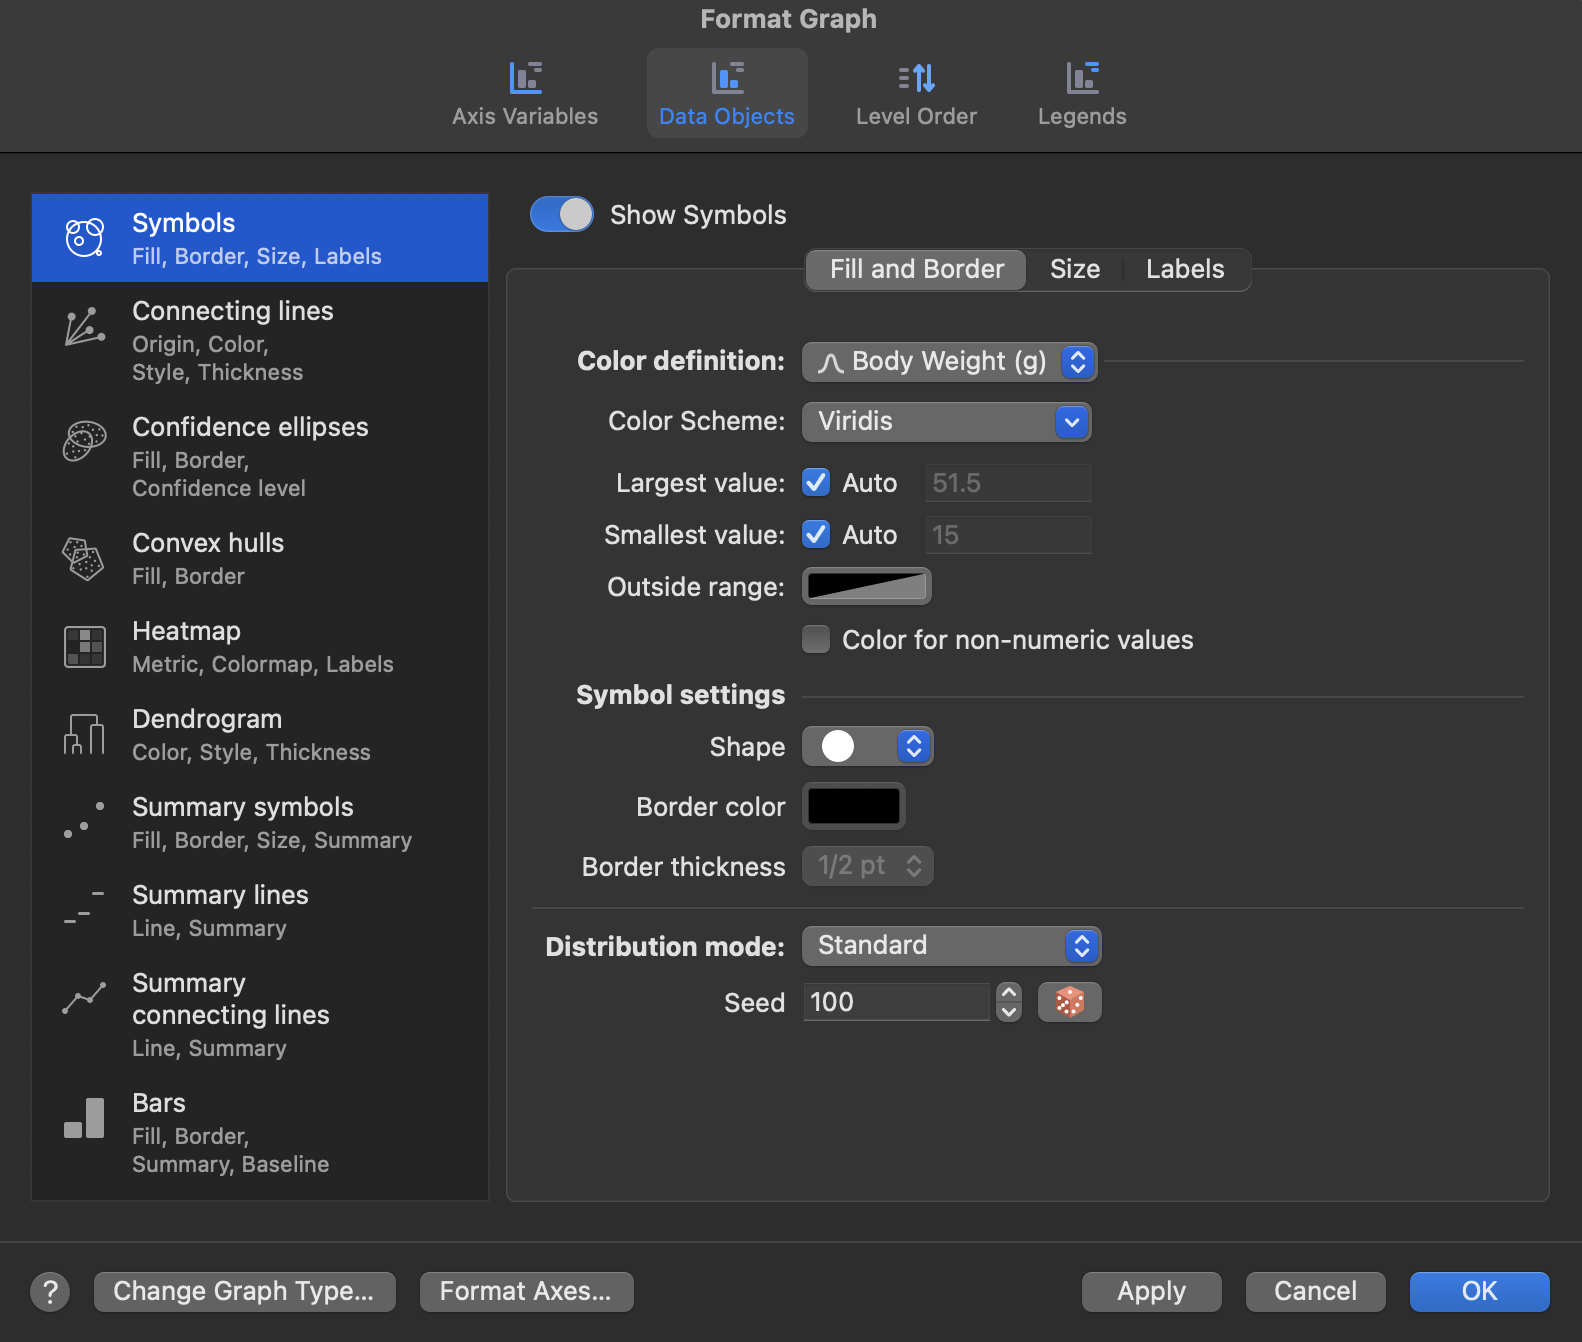
It’s also important to note that, by default, Prism will select appropriate numbers for the Largest value, Baseline value, and Smallest value. However, these can be entered manually by unchecking the Auto box beside each of these options and entering the desired value.
If the value for the continuous variable assigned to color lies outside the range defined by Largest value and Smallest value, there is an additional color dropdown that can be used to assign a specific color to these symbols.