There are two options to choose from on the Size tab, each of which will be discussed in its own section on this page:
•One size for the entire graph
•Variable
Note that these options operate similarly to the options for Fill Color.
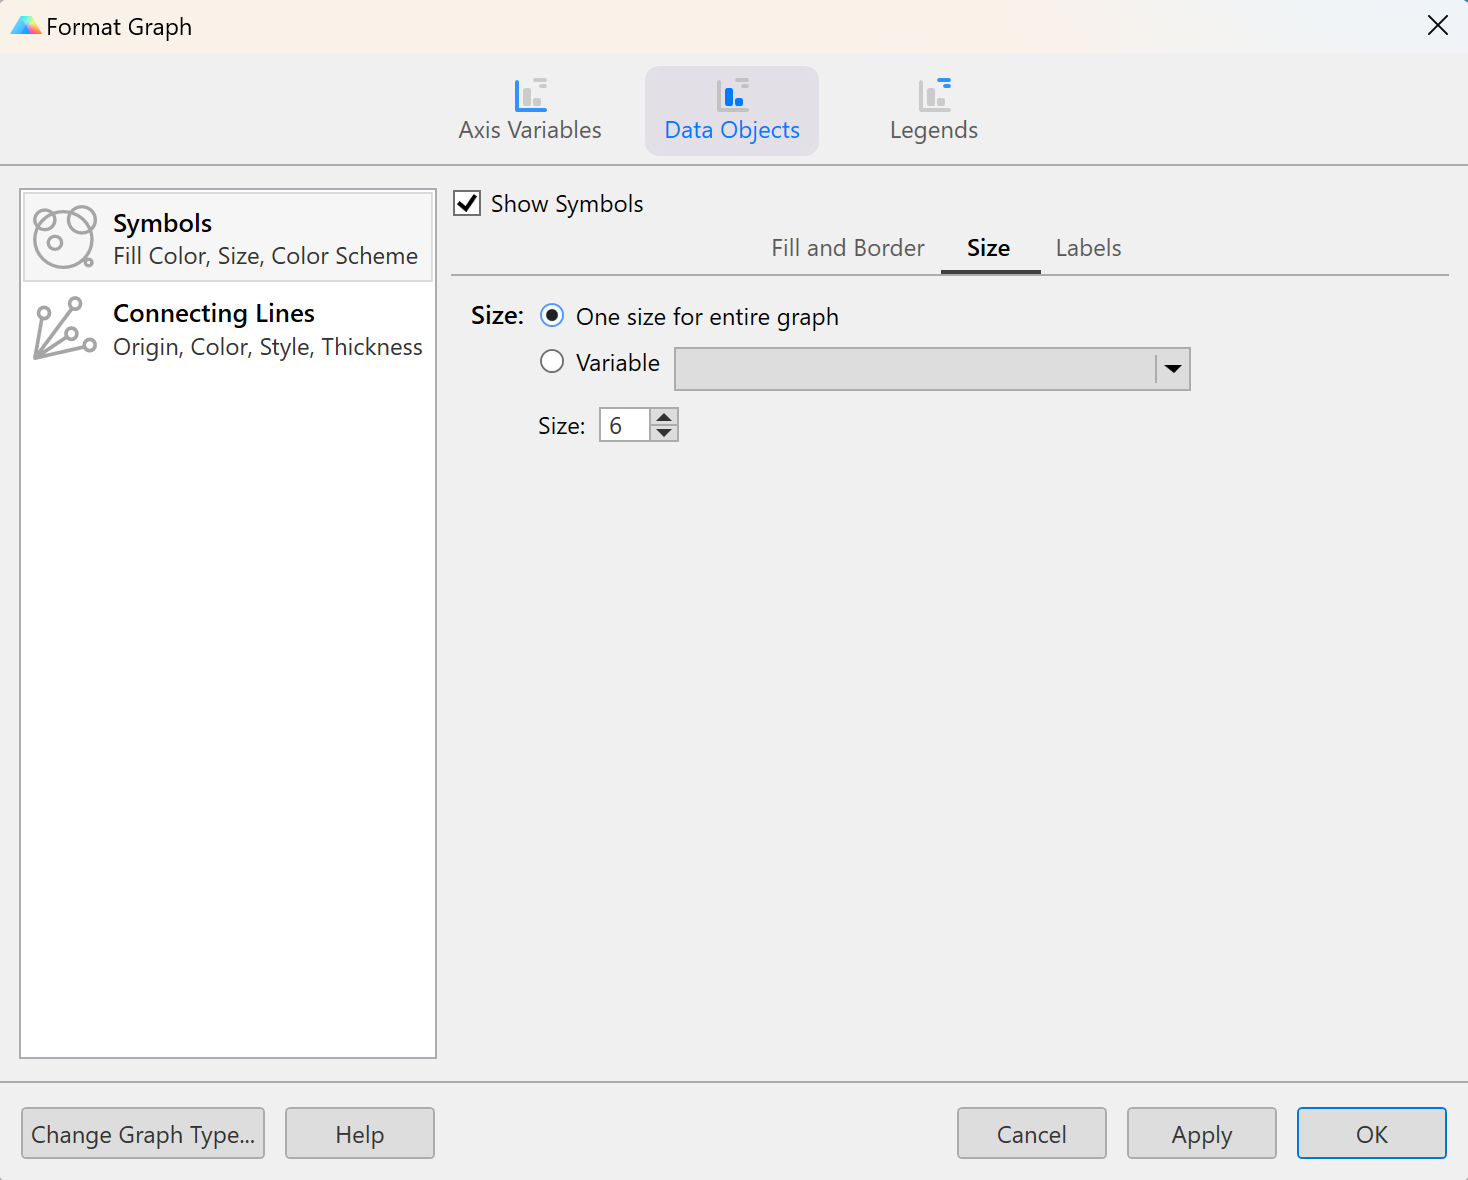
One size for the entire graph
Select a single symbol size that will be applied to ALL symbols plotted on the graph.
Variable
Select a variable to define symbol size on the graph. This variable can be either categorical or continuous.
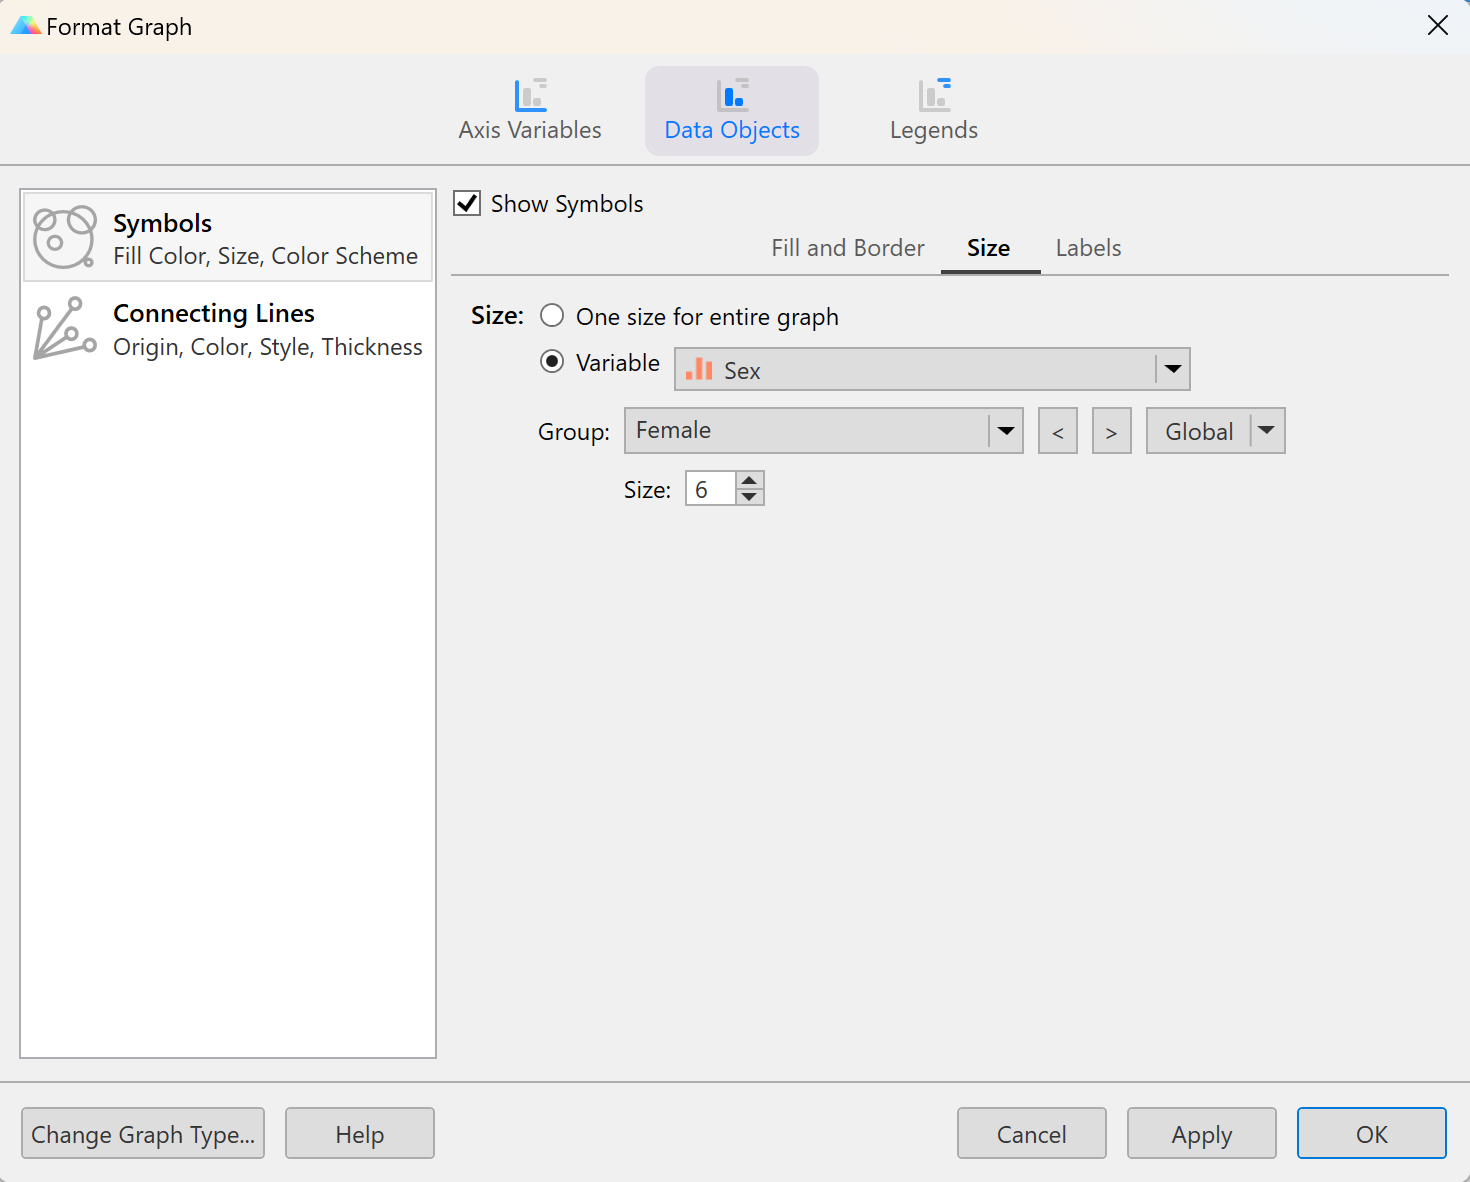
Categorical Variable
If choosing a categorical variable, each level of the selected categorical variable will be treated as its own group, and can be assigned its symbol size using the Size dropdown menu. Additionally, multiple groups (multiple levels of the selected categorical variable) can be selected at once using the Global dropdown menu.
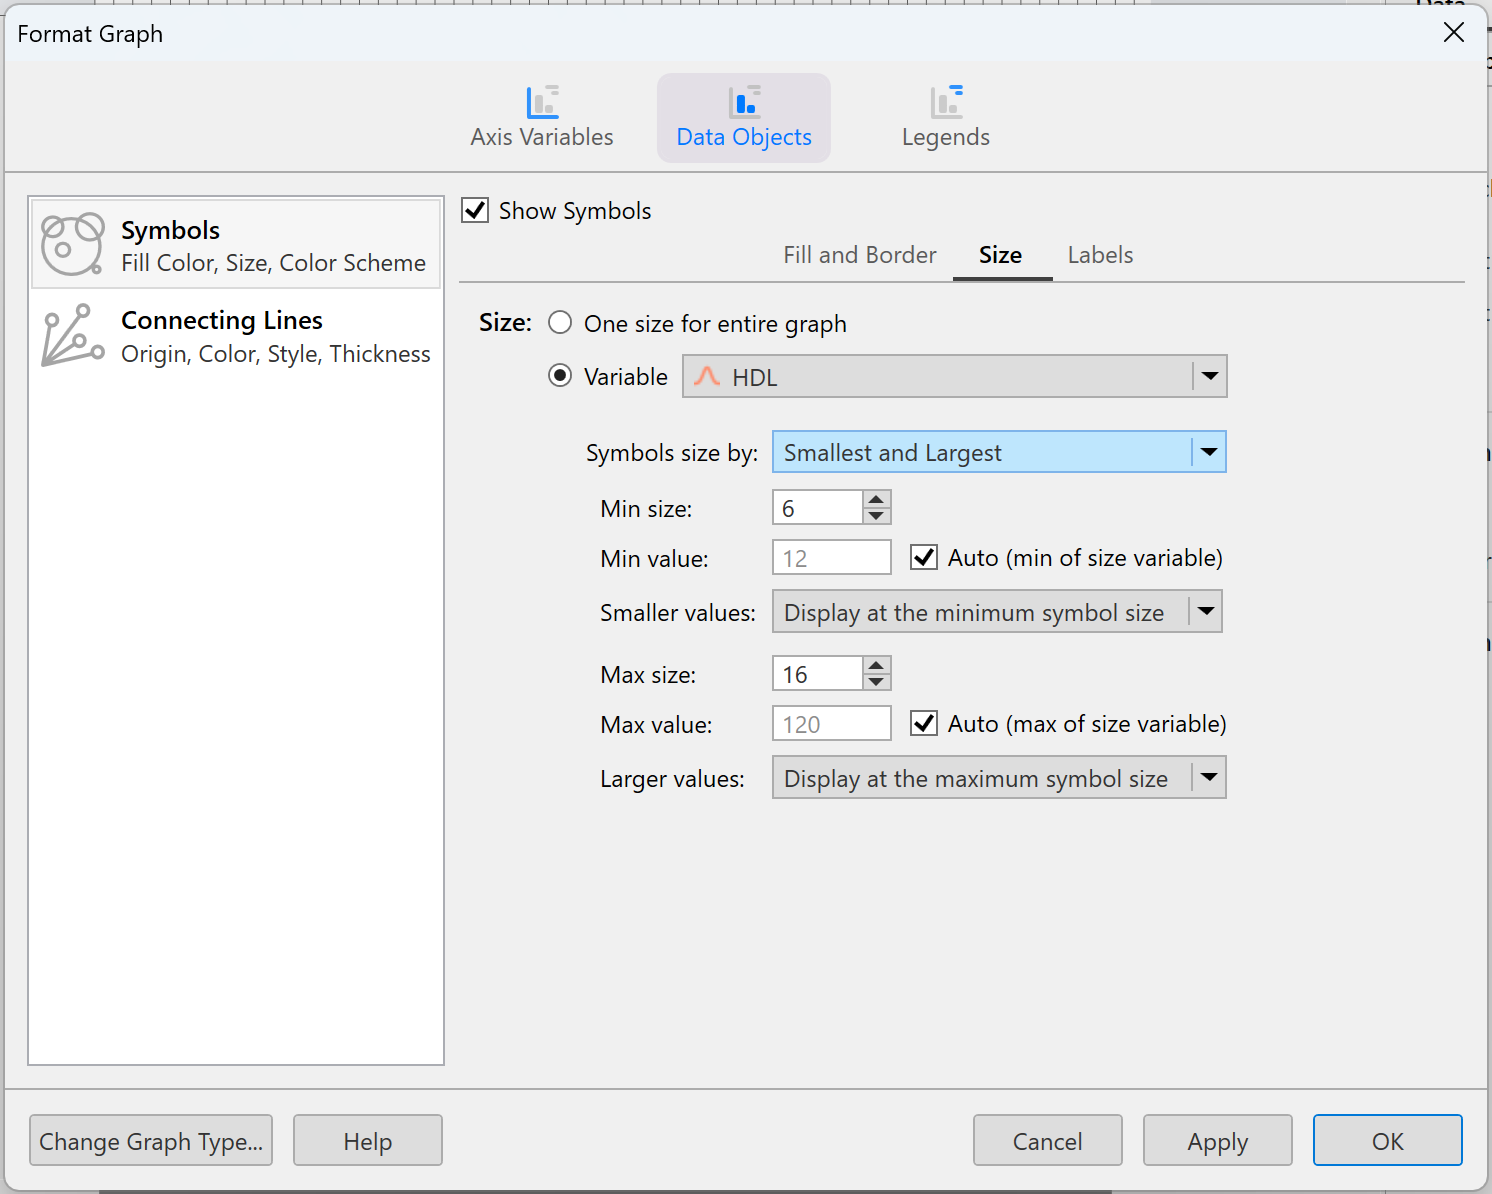
Continuous Variable
If choosing a continuous variable, Prism will use the values of the selected variable along with the selected size/scaling options to determine the size of each symbol on the graph. There are three symbol size options that you can choose from:
1.Scale symbols by defining the smallest symbol size
2.Scale symbols by defining the largest symbol size
3.Scale symbols by defining both the smallest and largest symbol size
This is one of two options that result in symbol areas being proportional to their variable value (the other being Largest below).
When using this option, all you have to define is the size of the smallest symbol (Min size). By default, this symbol size will correspond to the smallest value in the selected continuous size variable. If desired, you can choose to specify a different Min value for the smallest symbol size on the graph.
•Note that if you choose a value less than any value in the specified variable, all of the plotted symbols will be larger than the symbol size selected in Min size
•If you choose a value greater than the smallest value in the specified variable, you must also specify how Prism should handle values Smaller values than this custom Min value. There are two options:
oDisplay at the minimum symbol size. This will make any symbol with a value smaller than Min value the same size as specified by Min size
oOmit from the graph. This will cause any symbol with a value smaller than Min value to not be shown on the graph at all
All other symbols on the graph will be scaled according to their corresponding size variable value and the defined Min size. Keep in mind that for this method, symbol areas - not their radii - are proportional to their value in the size variable. So for example, if the smallest symbol corresponds to a value of 2, then a value of 4 will be assigned a symbol with an area twice that of the smallest symbol. A value of 6 will be assigned a symbol with an area three times greater than that of the smallest symbol.
This is one of two options that result in symbol areas being proportional to their variable value (the other being Smallest above).
When using this option, all you have to define is the size of the smallest symbol (Max size). By default, this symbol size will correspond to the largest value in the selected continuous size variable. If desired, you can choose to specify a different Max value for the smallest symbol size on the graph.
•Note that if you choose a value greater than any value in the specified variable, all of the plotted symbols will be smaller than the symbol size selected in Max size
•If you choose a value less than the largest value in the specified variable, you must also specify how Prism should handle values Larger values than this custom Max value. There are two options:
oDisplay at the maximum symbol size. This will make any symbol with a value larger than Max value the same size as specified by Max size
oOmit from the graph. This will cause any symbol with a value larger than Max value to not be shown on the graph at all
All other symbols on the graph will be scaled according to their corresponding size variable value and the defined Max size. Keep in mind that for this method, symbol areas - not their radii - are proportional to their value in the size variable. So for example, if the largest symbol corresponds to a value of 30, then a value of 15 will be assigned a symbol with an area half that of the largest symbol. A value of 10 will be assigned a symbol with an area three times less than that of the largest symbol.
This option for symbol size scaling does not keep the symbol areas proportional to their variable value!
When using this option, you specify both the size of the smallest symbol (Min size) and the size of the largest symbol (Max size). By default, Prism will use the smallest or largest value in the size variable to define these symbol sizes. However, you may choose to specify your own custom values (note that you will need to choose how to plot symbols for values that are less than the specified Min value or greater than the specified Max value).
All other symbols on the graph will be scaled using a linear function based on their value in the size variable. Note that the relationship between the size variable value for a symbol and its area are no longer directly proportionate. When using this method, a symbol for a value of 20 will not necessarily have an area twice that of a symbol for a value of 10. This is important to note since many readers are accustomed to interpreting the value of a symbol in this kind of graph as being directly proportionate to its value.
An example of symbol sizes using all three method
Consider a size variable with the following values:
Size:{10, 15, 20}
Using Smallest Size
If Min size was set to 10 (using the default Min value), then the symbol for the value "10" would be size 10 (area 25π), the symbol for the value "15" would be size 12.2 (area 37.5π), and the symbol for the value "20" would be size 14.1 (area 50π). It can be seen that the symbol area for the value "20" is double that of the symbol area for the value "10", and the symbol area for the value "15" is 1.5 times greater than the area for the value "10" as expected.
Using Largest Size
If Max size was set to 20 (using the default Max value), then the symbol for the value "20" would be size 20 (area 100π), the symbol for the value "15" would be size 17.3 (area 75π), and the symbol for the value "10" would be size 14.1 (area 50π). It can be seen that the symbol area for the value "20" is double that of the symbol area for the value "10", and the symbol area for the value "15" is 1.5 times greater than the area for the value "10" as expected.
Using both Smallest and Size
If Min size was set to 10 (using the default Min value) and Max size was set to 20 (using the default for Max value), then the symbol for the value "10" would be size 10 (area 25π), the symbol for the value "20" would be size 20 (area 100π), and the symbol for the value "15" would be size 15.81 (area 62.5π). In this case, because the value "15" is halfway between the values "10" and "20", the area of the symbol for the value "15" is halfway between the areas for the values "10" and "20" ([100π+25π]/2=62.5π). This is arguably less intuitive, but can be used to ensure that symbol sizes on the graph for ANY values are neither too large nor too small.
What if the symbols are too large for the legend?
In order to keep the symbol size legend of a multiple variable graph from becoming too large, there is a maximum symbol size that will be displayed in the size legend. In the event that a symbol on a multiple variable graph is larger than this maximum size, the largest symbol in the legend will simply be displayed at the maximum allowed size, and include a red dotted outline.
The value displayed for this legend symbol will be calculated by Prism based on the area of the symbol displayed (remember, the area of a symbol is directly proportional to the value in the size variable). However, this means that there will be values on the graph that are larger than the largest symbol in the legend. Because of this, a “greater than or equal to” sign (≥) is included with the maximum value in the legend.
How is the size of the middle symbol in the size legend determined?
Recall that the area of a symbol is proportional to the value it represents. The smallest symbol in the size legend is defined (either as the smallest value on the graph or by a specified value in the Format Graph dialog). The largest symbol in the size legend is either the maximum symbol size on the graph or the maximum symbol size allowed by the size legend, whichever is smaller. Either way, the value of the largest symbol can be calculated directly from its area.
But how is the area of the middle symbol in the legend calculated? First, Prism calculates a value for this symbol using the following formula:
Valuemiddle = sqrt(Valuesmallest * Valuelargest)
Using this value, Prism then determines what the area of this middle symbol should be, and generates an appropriately sized symbol. In other words, the value is the geometric mean of the smallest and largest value, and the symbol area is the geometric mean of the smallest and largest areas.