Features and functionality described on this page are available with our new Pro and Enterprise plans. Learn More... |
The Violins GDO plots a mirrored kernel density curve for each group, showing the distribution of data values along the continuous axis. The width of the violin at any point reflects the relative density of values at that position. Optional lines marking the median and quartiles can be overlaid on the violin shape.
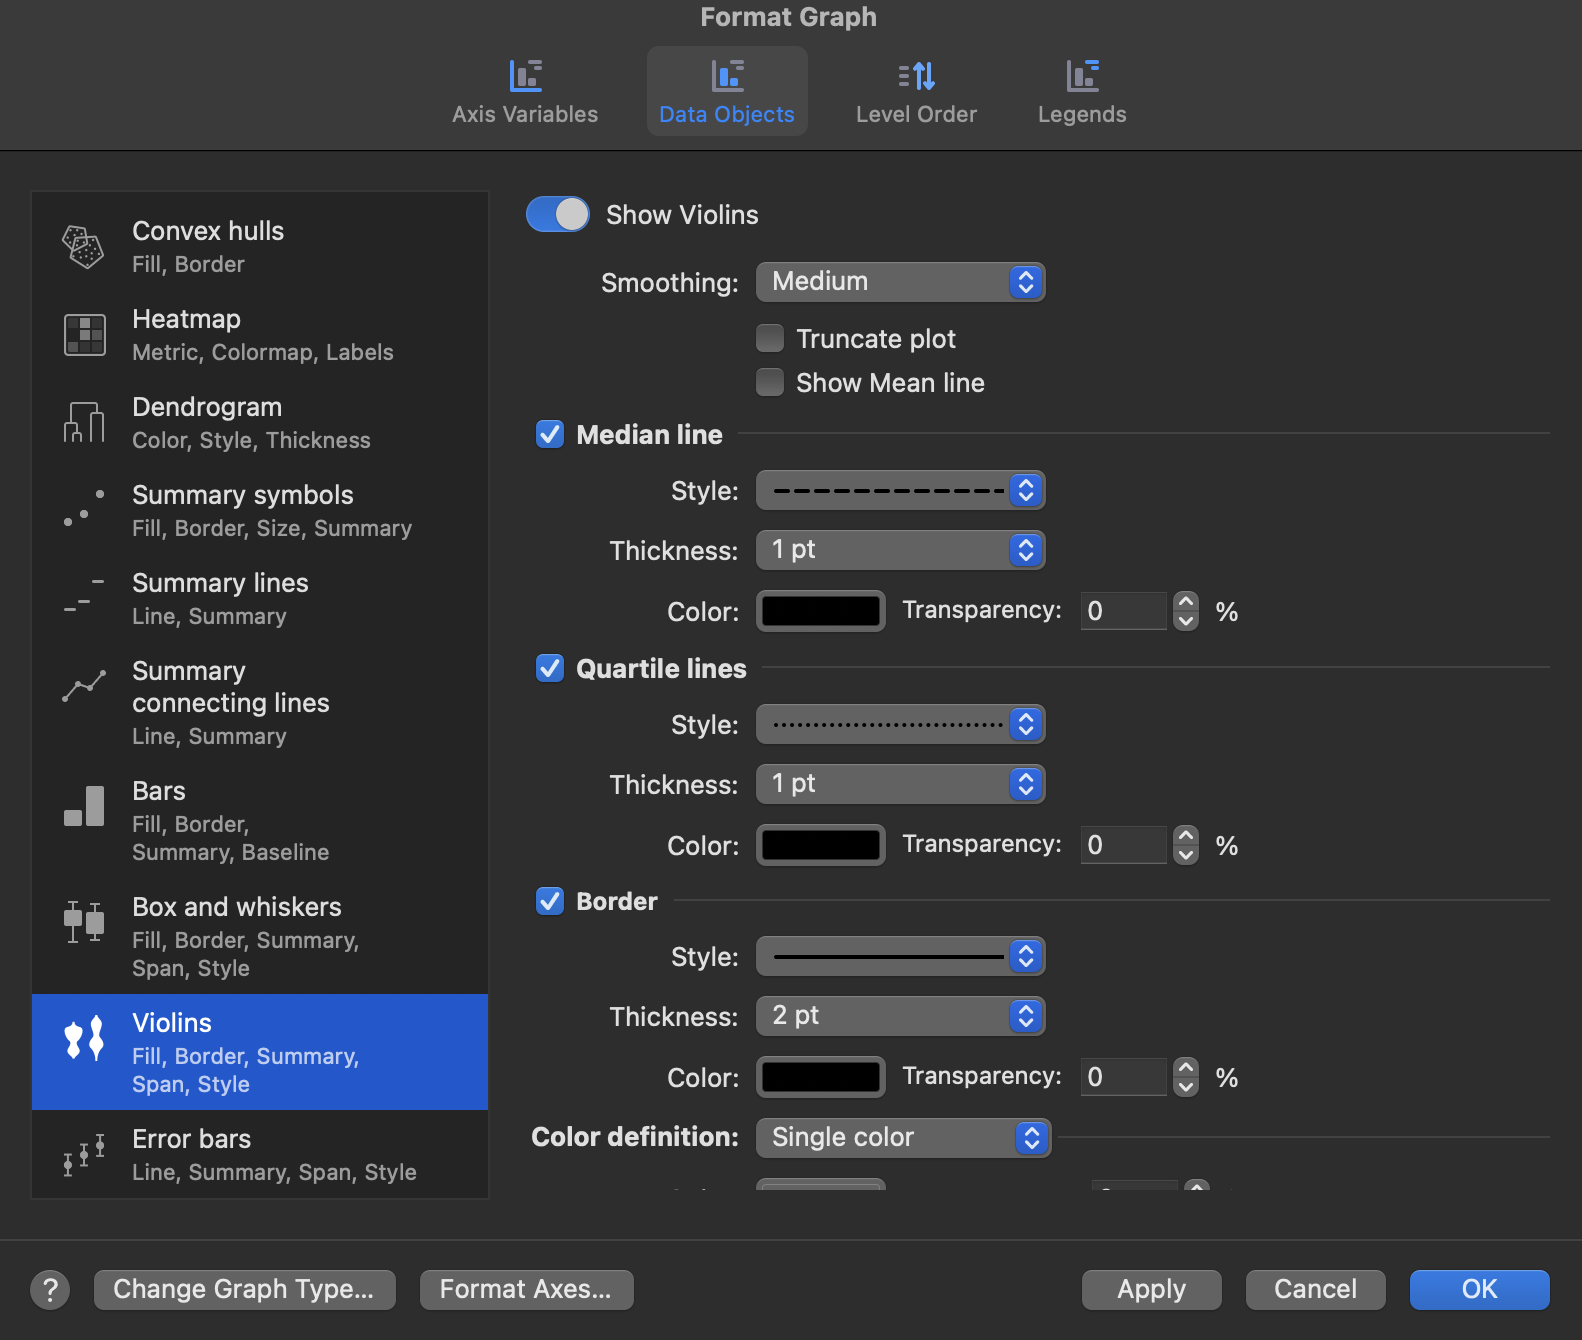
Shape
The following shape options can be set independently for each group:
•Smoothing: controls the amount of kernel smoothing applied to the density estimate. Options: Light, Medium, High. Lower smoothing follows the raw data more closely; higher smoothing produces a broader, smoother curve.
•Truncate: when on, the violin ends at the outermost data values rather than extending the density curve beyond them.
•Show Mean line: shows or hides a line inside the violin at the mean value.
Border
The following border options can be set independently for each group:
•Border visibility.
•Border stroke color.
•Border stroke thickness.
•Border stroke style: options are Solid, Dash, Dot, DashDot, and DashDotDot.
Reference lines
Prism can draw median and quartile reference lines across the interior of the violin. In the Format Graph dialog these options apply to the data object as a whole. To set them for one group only, select that group's violin on the graph and use the Graph Inspector.
Median line options:
•Median visibility: shows or hides the median reference line.
•Color.
•Thickness.
•Style: options are Solid, Dash, Dot, DashDot, and DashDotDot.
Quartile lines (25th and 75th percentile) options:
•Quartile visibility: shows or hides the quartile reference lines.
•Color.
•Thickness.
•Style: options are Solid, Dash, Dot, DashDot, and DashDotDot.
Color settings
Color settings apply to the GDO as a whole. Violin fill color can be defined in two ways:
•Single color: all violins use one fill color.
•Categorical variable: each level of the selected variable is assigned a color from the active color scheme. If a group in the axis variable corresponds to multiple levels of the color variable, it receives the color assigned to the "Undefined" level.
Note that gradient colormaps based on a continuous variable are not available for the Violins GDO.