Overview of nested tables
Prism 8 introduces a new kind of data table for nested data where values stacked in each subcolumn are related, and lets you graph these sensibly. In this example, there are two treatments given to three rats each and the outcome variable was measured four times in each rat.
Analyses performed from nested tables
•Nested t test
•Nested one-way ANOVA
•Descriptive statistics (separate results for each subcolumn)
•Normality (and lognormality) tests (separate results for each subcolumn)>
•Outlier tests (separate results for each subcolumn)
•One-sample t test (separate results for each subcolumn)
Example of a nested table
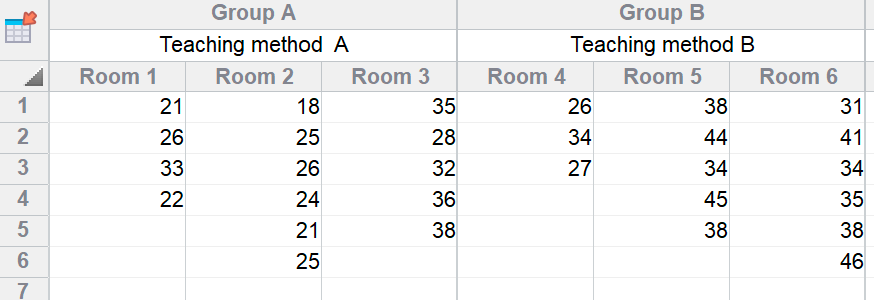
Each nested table must have at least two subcolumns. It is not possible to enter averaged data (mean, sd, n...). Error bars on graphs are computed from a stack of values in the same subcolumn.