Before you create a new graph, consider duplicating the graph. This is super useful.
To create a new graph of existing data:
1.From the data table, click the Create New Graph button. This will bring up the Create New Graph dialog.
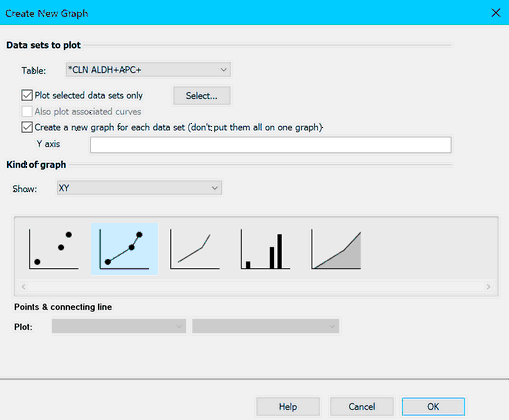
2.Check that the correct table is chosen in the drop-down list.
3.Check "Plot selected data sets only" if you don't want to plot all the data on the graph. Then click Select and choose the data sets to plot. You can only choose data set columns. You cannot choose a range of rows. All rows are always plotted.
4.If it is an XY table and you have fit a line or curve, check the option if you want the curve or line to also appear (as well as the data) on the new graph.
5.Usually Prism creates one graph from the entire data set. If you want one graph for each data set, check that option. If you choose to create a new graph for each data set, you can specify the Y-axis title here.
6.Choose the kind of the graph you want. The drop down lets you choose between XY, Column, Grouped, etc. graphs, but you'll almost always want the kind of graph that matches the data table.
7.Choose one of the thumbnails and make other choices to customize the graph.
To bring back this dialog, drop the Change menu and choose Graph Type, or click the button shown below.