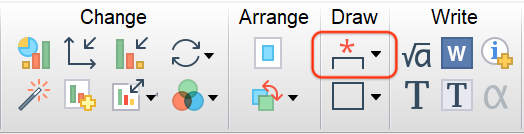
Prism provides the ability to automatically add lines or brackets with P values (or associated asterisks) to a graph of data after performing an appropriate analysis on that data. To access this feature, simply click on the toolbar button located in the Draw section of the toolbar (or select the menu item "Pairwise Comparisons" from the Insert menu).
Which analyses have comparisons that Prism can plot automatically?
T tests
Comparisons from all variants (paired/unpaired, parametric/non-parametric) can be added automatically.
Multiple t tests
Pairwise comparisons can be added automatically from all variants (paired/unpaired, parametric/non-parametric) of this analysis. However, the number of comparisons can quickly become too large to be displayed in an easily interpretable way on a single graph.
One sample t test and Wilcoxon test
These are only available when there are no subcolumns in the data, or (if there are subcolumns) the default option "Average the replicates in each row" is selected.
One-way ANOVA
All options for multiple comparisons following all variants (paired/unpaired, parametric/non-parametric) can be added automatically.
Two-way ANOVA
Multiple comparisons that compare individual cell means (but not comparisons of entire rows/columns) can be added automatically. Appropriate multiple comparisons for two-way ANOVA include:
•Compare each cell mean with the other cell mean in that column (only available for two-way ANOVA with exactly two rows)
•Compare each cell mean with the other cell mean in that row (only available for two-way ANOVA with exactly two columns)
•Within each row, compare columns (simple effects within rows)
•Within each column, compare rows (simple effects within columns)
•Compare cell means regardless of rows and columns
Format Pairwise Comparisons dialog
After performing an appropriate analysis (or re-calculating an appropriate analysis from an older version of Prism), clicking the toolbar the first time will automatically add lines and asterisks for all comparisons included in the analysis for that data set. Most of the time, that's all you'll need to do!
However, if you'd like to customize the appearance of the comparison lines/brackets, clicking on the toolbar button a second time (or double clicking on one of the comparison lines) will bring up the Format Pairwise Comparisons dialog.
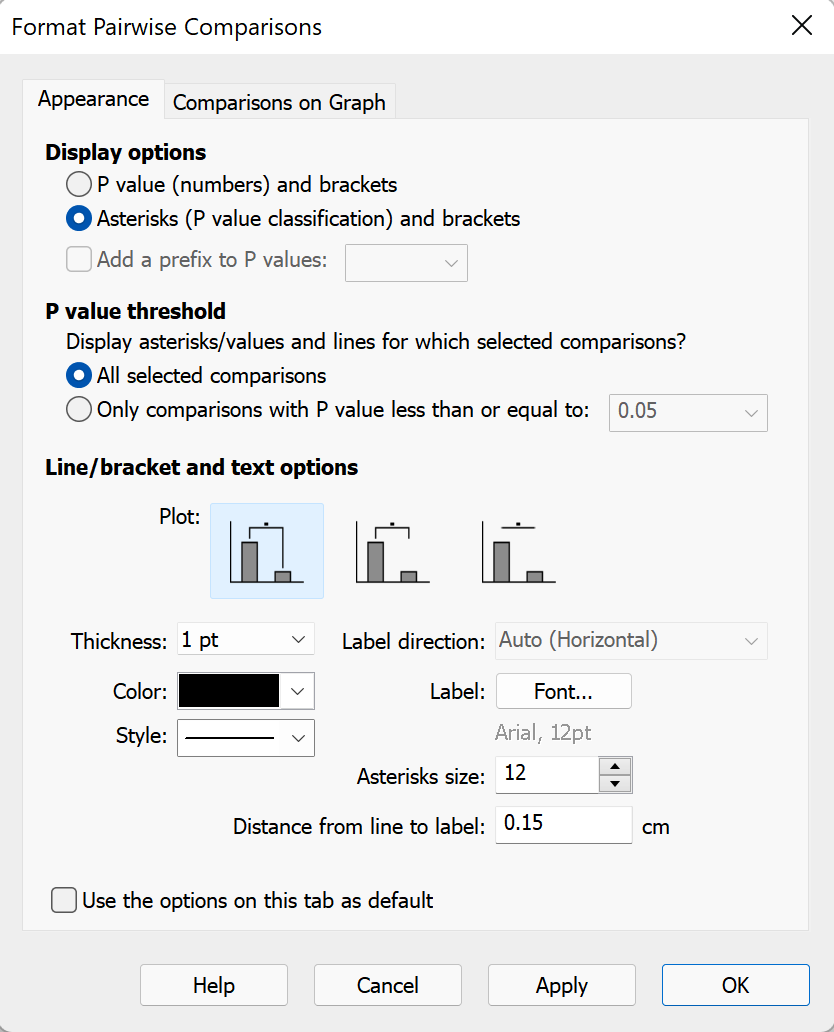
Appearance tab
The first tab (Appearance) of this dialog provides numerous controls that can be used to customize the appearance of the pairwise comparisons added to the graph. First, you can choose to display numeric P values or asterisks. If you choose to display numeric P values, you can also add a prefix such as the built-in "P =" or "p =" options, or a custom prefix that you prefer. You can also choose to display all pairwise comparisons, or only those that correspond to a P value below a specified cutoff threshold (custom values between 0 and 1 can be entered manually).
Additional options on this tab allow you to:
•Select from three different bracket styles
•Customize the appearance (thickness, color, and style) of the brackets
•Change the size of text labels and asterisks independently
•Specify the distance between each bracket and its label
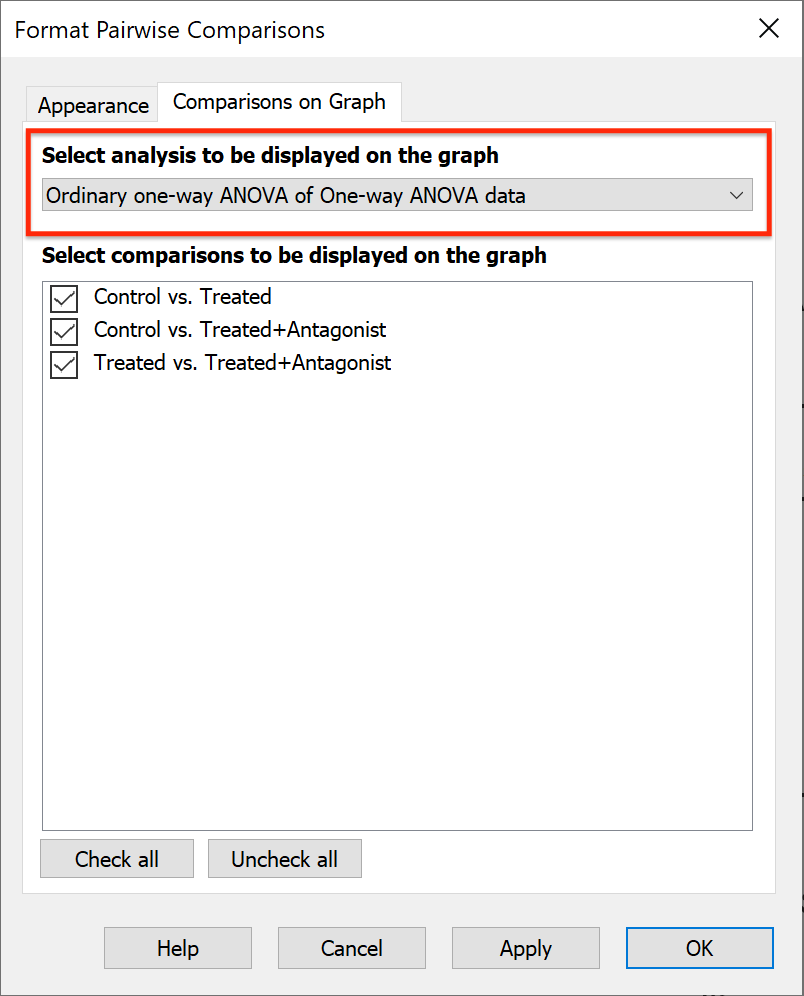
Comparisons on Graph tab
The second tab (Comparisons on Graph) of this dialog allows you to select specific comparisons to display or hide on the graph. By default, all comparisons defined by the analysis are displayed on the graph. If all pairwise comparisons have been deselected using this dialog (or removed from the graph by deleting them), clicking the Pairwise Comparisons toolbar button will toggle all comparison lines back on.
Formatting individual comparison lines
To change the settings of a single comparison line, simply right-click on the line you would like to customize. From the menu that appears, you can choose to change:
•Text font, color, size, and appearance
•Line color, thickness, and style
•Title position (for vertical graphs, this controls if the text is above or below the line. For horizontal graphs, this controls if the text is to the left or right of the line.)
•For horizontal graphs, you can also choose for the text direction to be either "up" or "down"
Note that all of these items can also be applied to multiple comparison lines simultaneously. Simply click and drag to select multiple lines, or click multiple lines while holding the shift key on your keyboard before applying the custom settings.
Selecting the test to display
Prism will only automatically display comparisons from a single analysis. If you've performed more than one of the tests listed above on the graphed data set (it's unlikely that this would be required or - in some cases - even appropriate), you'll need to identify which test includes the comparisons you'd like to display. If you decide later that you want to display comparisons from a different test performed on the same data, you can choose which analysis results to display from the dropdown menu on the Comparisons on Graph tab of the Format Pairwise Comparisons dialog.
Removing Pairwise Comparison lines from your graph
If you decide you no longer want the comparison lines on your graph, there are a number of ways that they can be removed. To remove a single comparison line, you can select the line to be removed by clicking it, then simply pressing the "delete" key on your keyboard. Alternatively, you can open the Format Pairwise Comparisons dialog, switch to the Comparisons on Graph tab, and deselect the desired comparison(s) in the list there.
To remove ALL comparison lines from the graph, click on the dropdown portion of the Pairwise Comparisons toolbar button and select "Remove Pairwise Comparisons". Alternatively, you can open the Change main menu, select "Pairwise Comparisons", and then select "Remove Pairwise Comparisons". Note: this will not simply hide the comparison lines. This removes them from the graph and erases any custom appearance settings that had been applied to them.
Data from multiple data tables on a single graph
This feature works only when there is data from a single data table displayed on the graph. Comparisons will not be shown on a graph if it contains data from more than one data table
Graph type not supported
In some cases, it's not possible to draw the results of pairwise comparisons automatically on the graph even if an appropriate analysis had been performed on the data. This is generally because the graph has groups that are stacked. Consider the following data in Table 1 and displayed on Graph 1 as an example in which adding pairwise comparison results is not a problem:
Table 1 |
||||||
|
Condition 1 |
Condition 2 |
||||
Group A |
10 |
12 |
8 |
9 |
7 |
8 |
Group B |
16 |
14 |
15 |
9 |
11 |
7 |
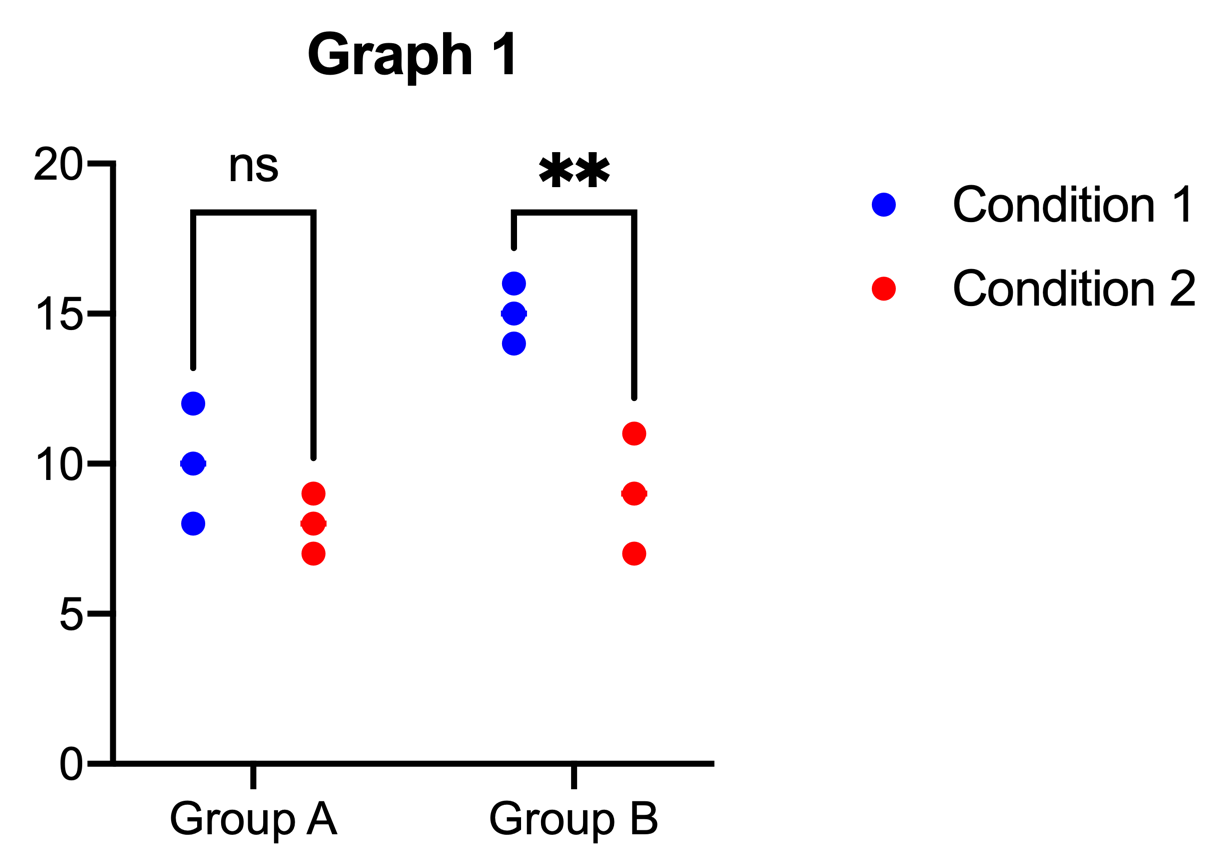
A two-way ANOVA (with no repeated measures) was performed on the data in Table 1. Multiple comparisons were performed, comparing "each cell mean with the other cell mean in that row." (in other words, Group A under Condition 1 was compared to Group A under Condition 2, and Group B under Condition 1 was compared to Group B under Condition 2). As shown on Graph 1, there's no problem displaying the results of these multiple comparisons using lines/asterisks.
However, if a stacked grouped graph is used instead, there's no way for the results to be displayed accurately. This issue is displayed in Graph 2 below.
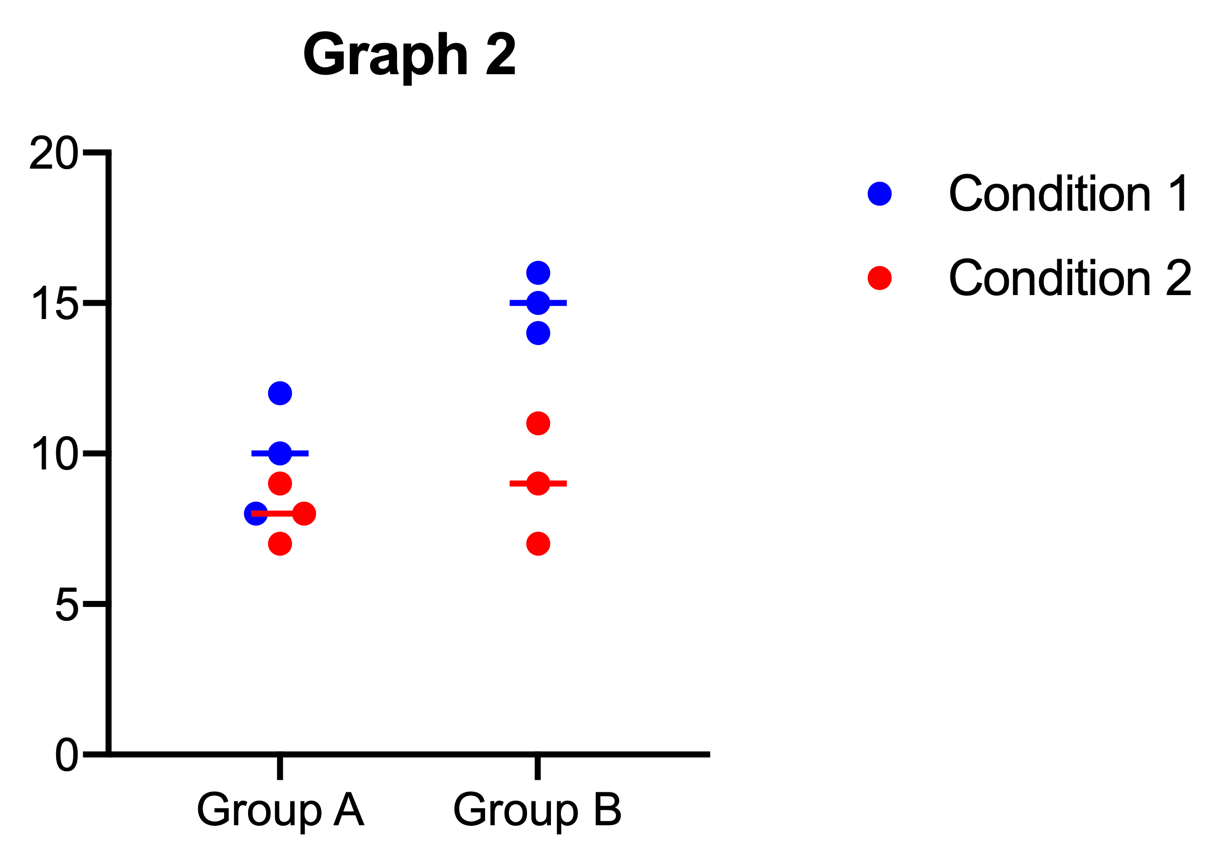
As shown in Graph 2 above, the groups being compared are now stacked on top of each other (for example, the points for Group A under Condition 1 and the points for Group A under Condition 2 are all stacked in the same location). As a result, the horizontal distance between the groups being compared is zero! In order to add comparison lines on Graph 2, the lines would need to have a length of zero, and so are simply not drawn.
Graph types that are not supported
The ability to add Pairwise Comparisons in Prism depends on the type of graph generated and the graph family that it belongs to. Presently, Pairwise Comparisons cannot be added to graphs that belong to the following graph families:
•XY
•Survival
•Nested
•Parts of whole
•Multiple variables
•Nested
•Heat map (part of grouped)
•Three-way (part of grouped)
Analysis performed with Wand and results never viewed
There is one scenario in which a valid analysis and a valid graph will still result in Prism displaying an alert that pairwise comparisons cannot be added to the graph. This happens when the wand tool was used to duplicate an analysis for the data, but the results have not yet been viewed. Essentially, without visiting (and loading) the results of the duplicated analysis, the Pairwise Comparisons feature is unable to display the appropriate P value summaries for the selected comparisons.
The solution here is to simply open the duplicated results sheet before trying to add the Pairwise Comparisons to the graph.