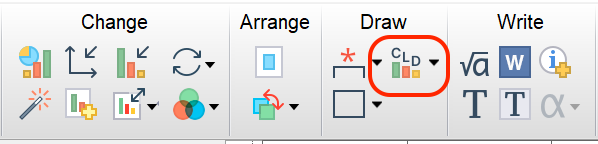
As an alternative to the commonly used Pairwise Comparisons feature, Prism offers the ability to add a Compact Letter Display (CLD) to a graph after performing an appropriate analysis on the plotted data. To access this feature, simply click on the toolbar button located in the Draw section of the toolbar (or select the menu item "Compact Letter Display" from the Insert menu while viewing the graph).
What is a CLD and how is it interpreted?
The CLD is an alternative method to displaying the results of multiple pairwise comparisons on a graph that doesn't use brackets with asterisks or P values. Instead, each group is assigned a set of letters (or numbers). Groups may be assigned multiple different letters, but every group will be given at least one letter. Using these letters, any two groups can be compared. If two groups share a letter, it indicates that the P value for the pairwise comparison between them was not smaller than the specified alpha level. In other words, assuming that the standard value of alpha of 0.05 was used, then for any two groups that share a letter, it can be determined that the P value calculated for the comparison of these two groups was not less than 0.05.
Here's an example of the visual and tabular output of the pairwise comparisons to make this more clear:
Tukey's multiple comparisons test |
Predicted (LS) mean diff. |
95.00% CI of diff. |
Below threshold? |
Summary |
Adjusted P Value |
|
|
|
|
|
|
Serum starved:Wild-type cells vs. Serum starved:GPP5 cell line |
-54.90 |
-69.60 to -40.20 |
Yes |
**** |
<0.0001 |
Serum starved:Wild-type cells vs. Serum starved:GPP7 cell line |
-42.50 |
-57.20 to -27.80 |
Yes |
**** |
<0.0001 |
Serum starved:Wild-type cells vs. Normal culture:Wild-type cells |
14.10 |
-0.5971 to 28.80 |
No |
ns |
0.0652 |
Serum starved:Wild-type cells vs. Normal culture:GPP5 cell line |
8.500 |
-6.197 to 23.20 |
No |
ns |
0.4882 |
Serum starved:Wild-type cells vs. Normal culture:GPP7 cell line |
-4.100 |
-18.80 to 10.60 |
No |
ns |
0.9509 |
Serum starved:GPP5 cell line vs. Serum starved:GPP7 cell line |
12.40 |
-1.457 to 26.26 |
No |
ns |
0.0978 |
Serum starved:GPP5 cell line vs. Normal culture:Wild-type cells |
69.00 |
55.14 to 82.86 |
Yes |
**** |
<0.0001 |
Serum starved:GPP5 cell line vs. Normal culture:GPP5 cell line |
63.40 |
49.54 to 77.26 |
Yes |
**** |
<0.0001 |
Serum starved:GPP5 cell line vs. Normal culture:GPP7 cell line |
50.80 |
36.94 to 64.66 |
Yes |
**** |
<0.0001 |
Serum starved:GPP7 cell line vs. Normal culture:Wild-type cells |
56.60 |
42.74 to 70.46 |
Yes |
**** |
<0.0001 |
Serum starved:GPP7 cell line vs. Normal culture:GPP5 cell line |
51.00 |
37.14 to 64.86 |
Yes |
**** |
<0.0001 |
Serum starved:GPP7 cell line vs. Normal culture:GPP7 cell line |
38.40 |
24.54 to 52.26 |
Yes |
**** |
<0.0001 |
Normal culture:Wild-type cells vs. Normal culture:GPP5 cell line |
-5.600 |
-19.46 to 8.257 |
No |
ns |
0.8059 |
Normal culture:Wild-type cells vs. Normal culture:GPP7 cell line |
-18.20 |
-32.06 to -4.343 |
Yes |
** |
0.0055 |
Normal culture:GPP5 cell line vs. Normal culture:GPP7 cell line |
-12.60 |
-26.46 to 1.257 |
No |
ns |
0.0894 |
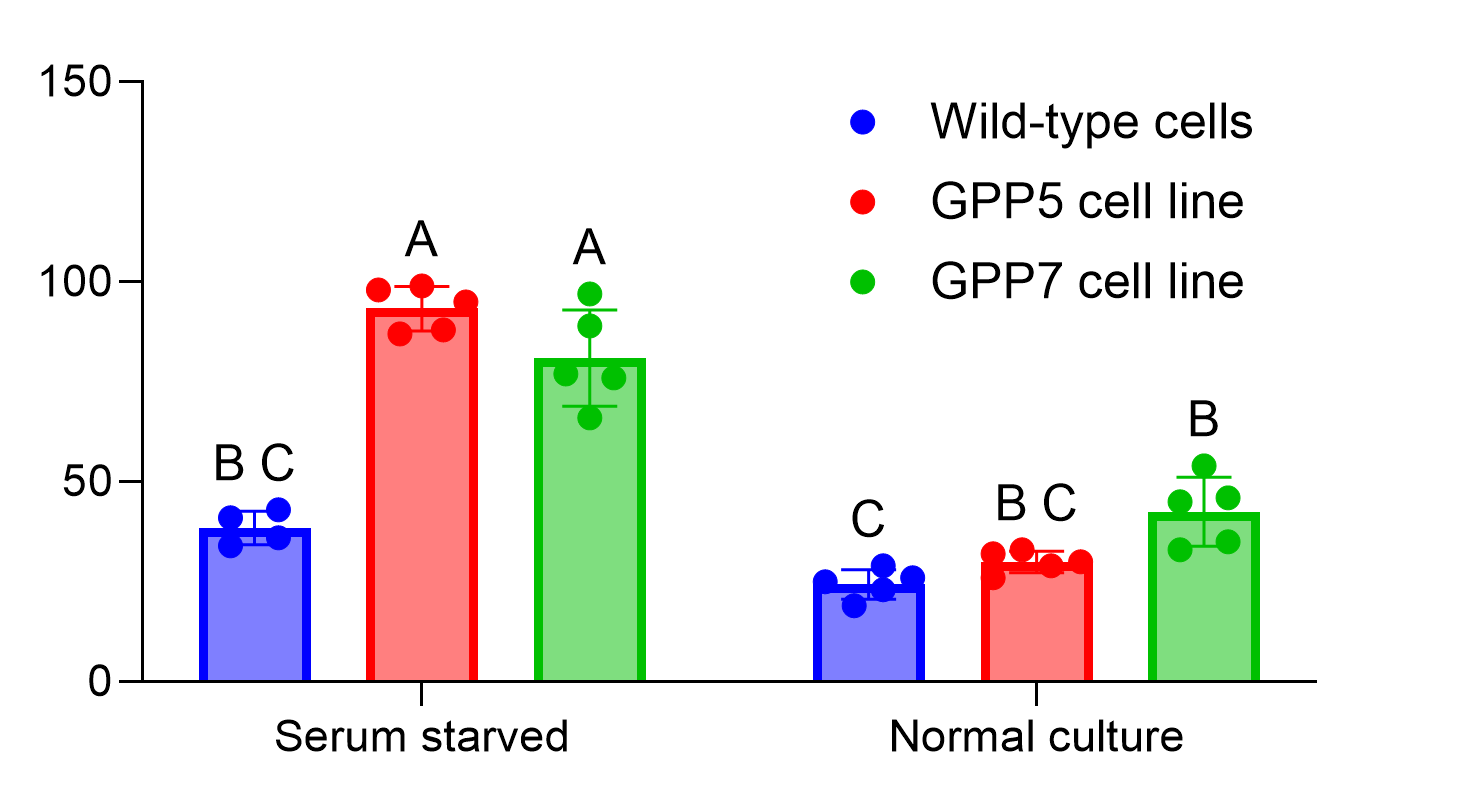
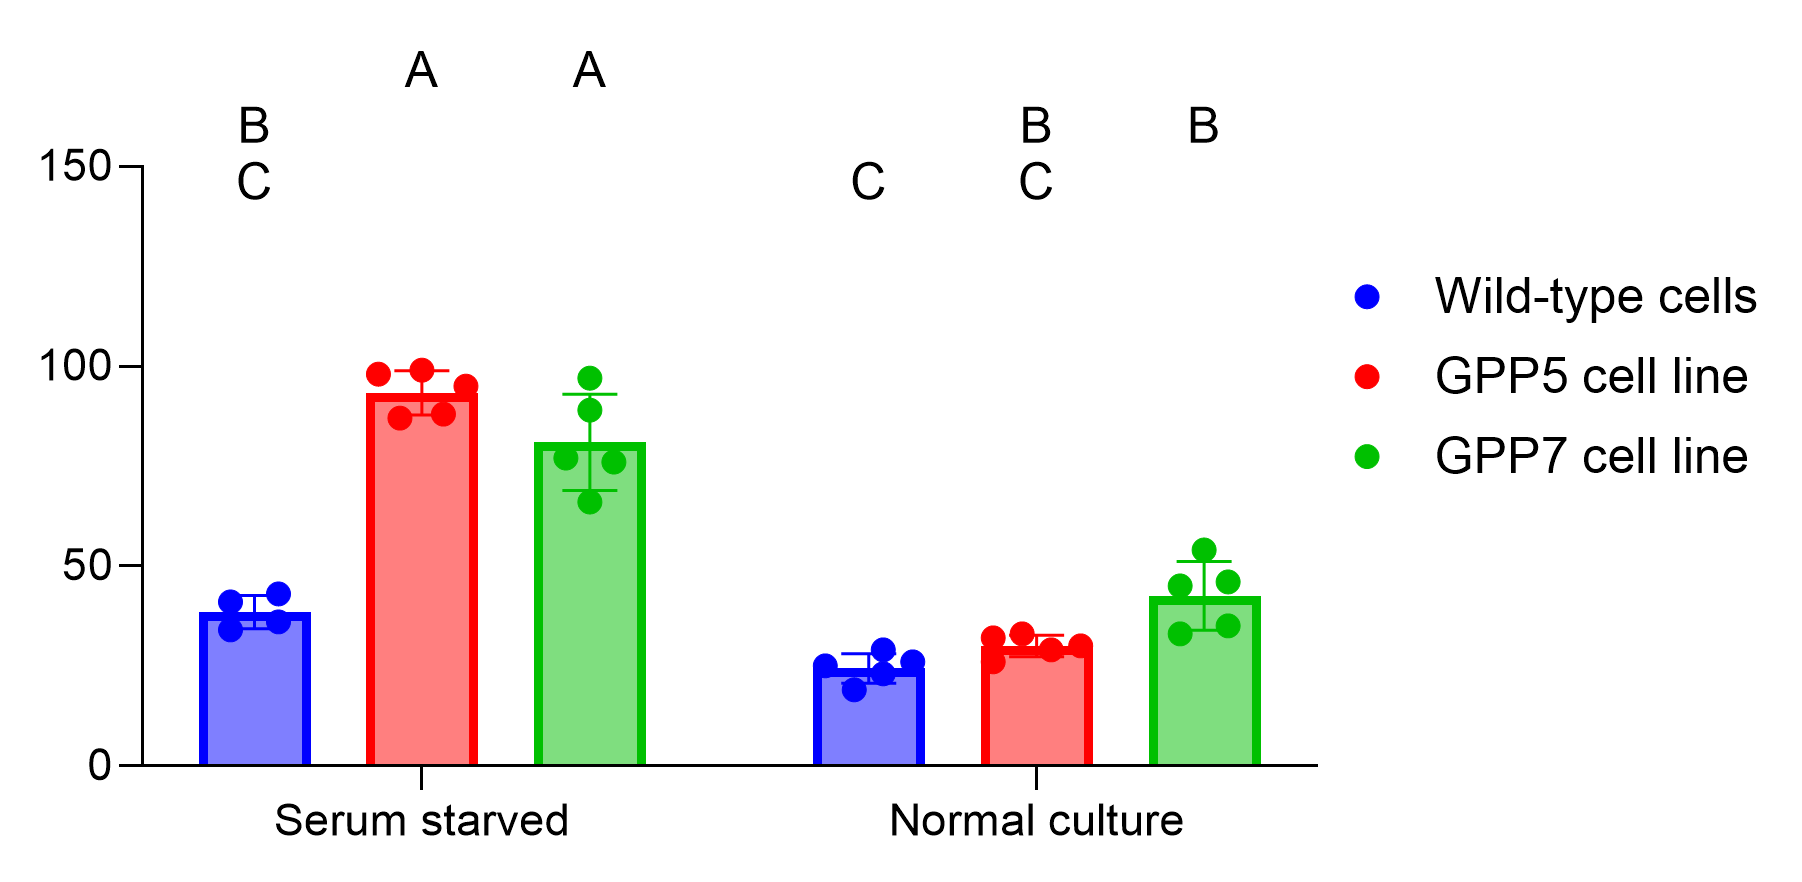
Start by looking at the groups "Serum starved:GPP5 cell line" and "Serum starved:GPP7 cell line". On the graph, we see that both of these have been assigned the letter "A". Since these two share a letter, we would expect that the P value for the pairwise comparison between these two groups was found to be greater than the alpha value (in this case 0.05). Looking at the table, we see that this is the case, and the adjusted P value for this comparison is 0.0978.
Alternatively, we can look at the group "Serum starved:Wild-type cells". This group has been assigned the letters "B" and "C", meaning comparisons between this group and any other group containing the letter "B" or "C" should have a P value greater than the specified value of alpha (0.05). For example, if we compare it to "Normal culture:Wild-type cells" with the letter assignment "C", we see an adjusted P value of 0.0652. Similarly, comparing to the group "Normal Culture:GPP7 cell line" with the letter assignment "B" we find a corresponding P value of 0.9509. However, if we compare to the group "Serum starved:GPP5 cell line" with the letter assignment "A", we would expect that the P value would be smaller than the specified value of alpha (since the two groups do not share any letter assignments). Indeed, the adjusted P value for this comparison is <0.0001.
Why use a Compact Letter Display
If the CLD simply displays a summary of all multiple comparisons, why not use the Pairwise Comparisons feature built into Prism? One major reason is to decrease the complexity and clutter of your graph. Consider the same graph as above using a CLD vs using Pairwise Comparisons:
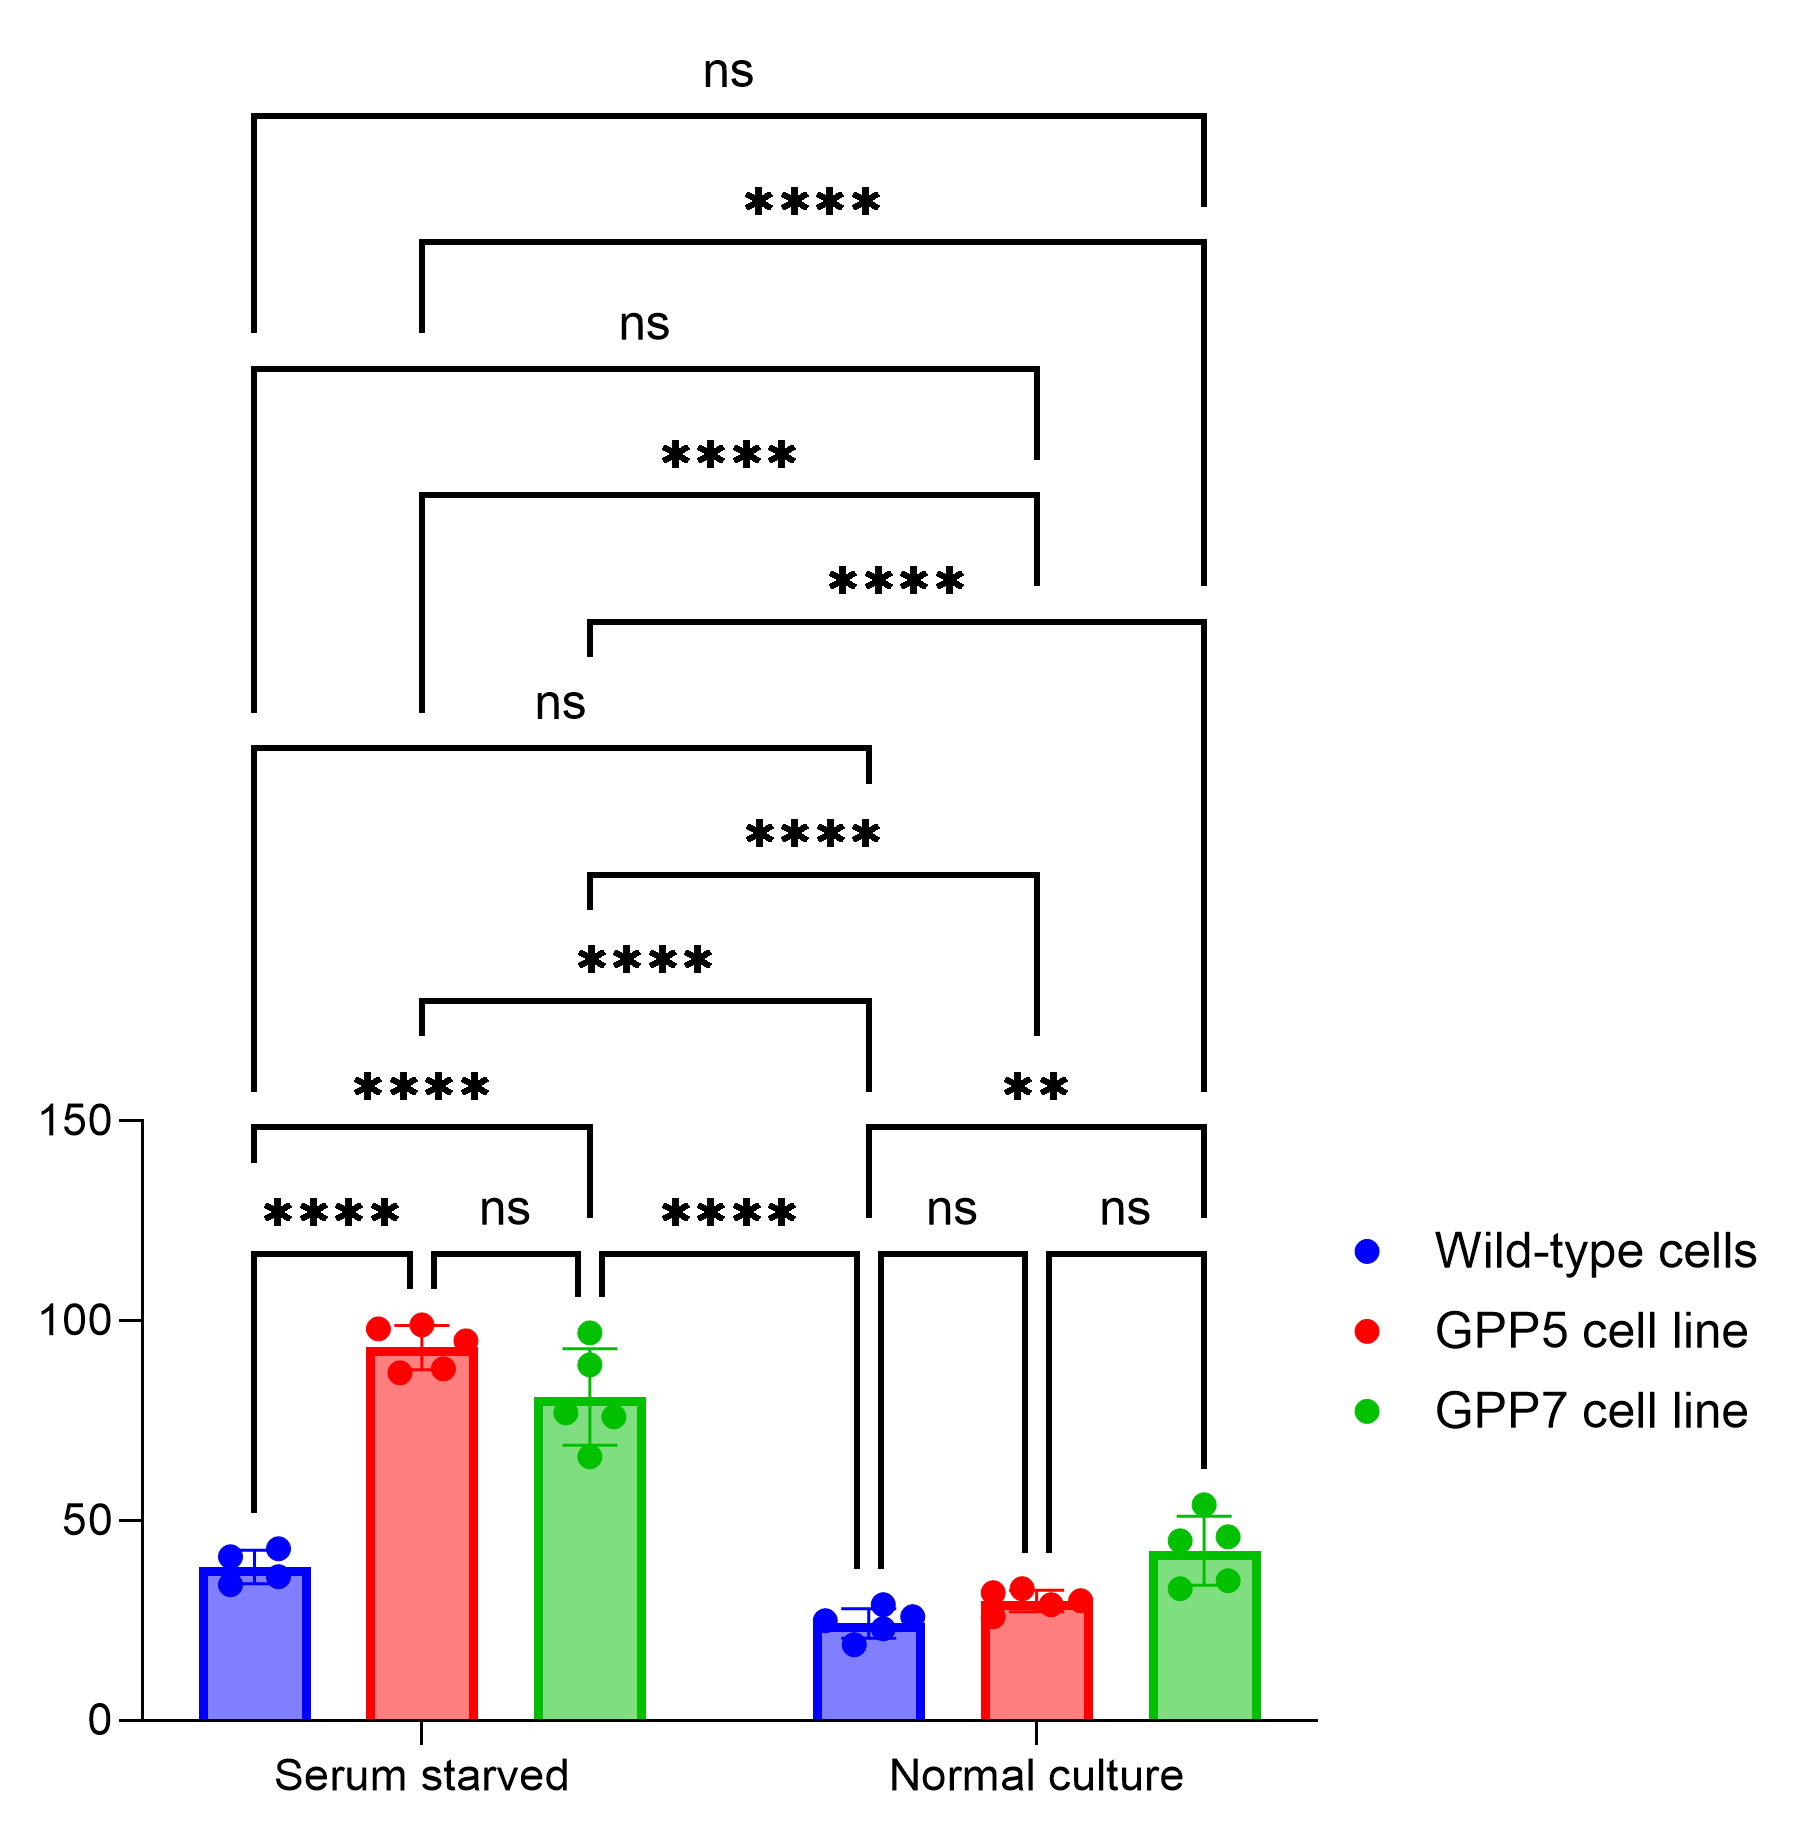
It should be relatively easy to see that using the CLD dramatically reduces the amount of content displayed on your graph, making it easier to interpret. However, keep in mind that the CLD may be less familiar to some readers, and so may require a bit more explanation to ensure the correct interpretation.
Which analyses support Compact Letter Display?
Compact Letter Displays only make sense when comparing every group with every other group. As such, the CLD can be used with:
•One-way ANOVA (and all of its variants including paired/unpaired, parametric/non-parametric) with the multiple comparisons method "Compare the mean (rank) of each column with the mean (rank) of every other column"
•Two-way ANOVA with the multiple comparisons method "Compare cell means regardless of rows and columns"
Note that adding a CLD to a graph of data following a t test is possible, but is not recommended as it is neither as informative or as intuitive as simply using the Pairwise Comparisons feature to add a numeric P value or summary asterisk.
Format Compact Letter Display dialog
After performing an appropriate analysis (or re-calculating an appropriate analysis from an older version of Prism), clicking the CLD toolbar button the first time will automatically add the CLD to the graph. Most of the time, that's all you'll need to do!
However, if you'd like to customize the appearance of the CLD, clicking on the toolbar a second time (or double clicking on one of the CLD letters) will bring up the Format Compact Letter Display dialog.
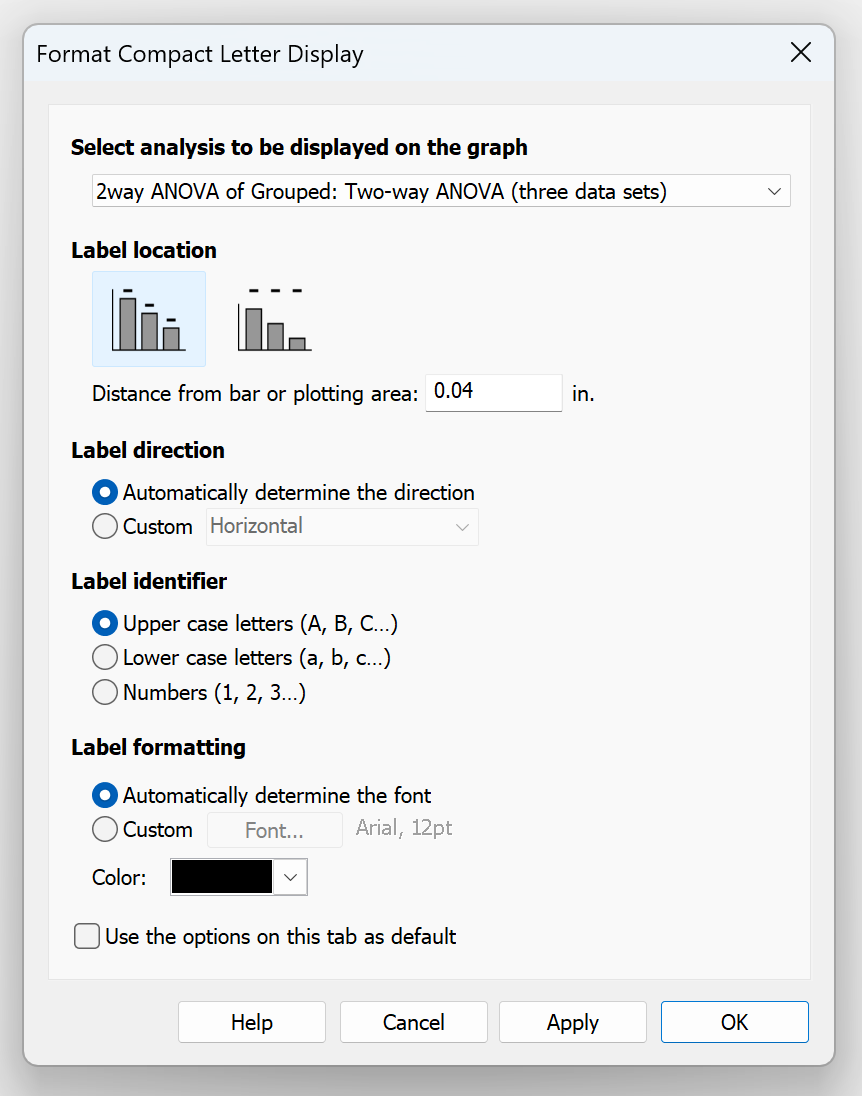
Select analysis to be displayed on the graph
Prism is only capable of displaying the CLD for a single analysis. If you've performed more than one appropriate analysis on the graphed data (even if this is unlikely), you'll need to identify which test includes the comparisons you'd like to use to generate the CLD.
Label location
This option indicates if you would like to add the CLD letters directly above the data (bars, symbols, error bars, etc.), or if you would like to add them outside of the graphing area. Note that if you choose to use the second option, there will be only one option for the label direction (see below). Here is an example of the two options for label location using the same graph from above:
Note that in the second variant, the labels are arranged in such a way that each letter is found at the same "height" (or in the same row). When there are a LARGE number of groups, this makes it easy to scan across a given row to see which other groups share (or don't share) a letter with any given group.
Label direction
These controls allow you to specify the text direction for the CLD labels. Prism will try to automatically determine the direction based on a number of factors including the number of groups, the size of the graph, and more. Alternatively, you can manually choose the label direction from one of the following:
•Horizontal
•Vertical (Up)
•Vertical (Down)
•Stacked
Note that if you choose the label location that places the labels outside of the graph area (see above), the only label direction available will be Stacked.
Label identifier
These controls can be used to choose between upper case letters (A, B, C...), lower case letters (a, b, c...), or numbers (1, 2, 3...) to use as the labels for the CLD. Note that Prism's default is to use upper case letters, while it is also very common to see lower case letters as well. Numbers are used infrequently.
Label formatting
These controls can be used to specify the font of the CLD labels, their size, and their color. Note that if the "Automatically determine the font" option is selected, Prism will automatically change the size of the labels depending on the amount of space available (based on the number of groups, size of the graph, etc.).