The idea of grouped variables is best understood by example. One grouping variable might be "male vs. female"; the other grouping variable is "control vs. treated." Every data point you collect is categorized by both grouping variables: "male vs. female," AND "control vs. treated." A two-grouping variable table and graph is used to tabulate outcomes that are measurements such as weight or blood pressure, often with error bars.
Analyses performed with Grouped data
•Two-way ANOVA (and mixed model)
•Three-way ANOVA (and mixed model)
•Row means with SD or SEM
•Multiple t tests - one per row
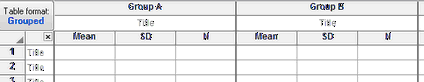
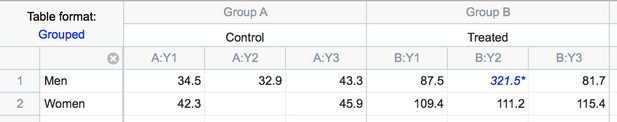
Example of a grouped table
Notes:
•Unlike other programs, Prism does not use separate columns to enter grouping variables. Instead, groups are defined by rows and columns.
•The rows categorize the data by one grouping variable (men vs. women).
•The columns (datasets) categorize the data by the other grouping variable (control vs. treated).
•Blank cells represent missing values, which Prism handles properly. If you are doing repeated-measures ANOVA, however, you can't have any missing data values unless an entire subcolumn is empty.
•Blue italics values are “excluded” (ignored by analyses and graphs). Use Edit… Exclude values.
•A grouped data table can contain 256 data set columns and as many as 256 sub-columns
Error bars
Prism will compute and graph error bars from replicate values placed in side by side subcolumns as shown (duplicate values) in the table above. Specify the number of subcolumns when you create a new table.
You can also choose to create subcolumns formatted for entry of error values computed elsewhere.