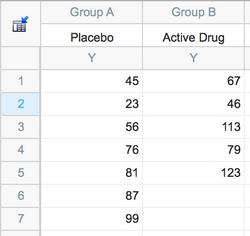
In a column data table, each column defines a group. These groups are defined by one scheme, perhaps "control vs. treated." You can have more than two groups in a one-way table, for example "placebo vs. low-dose vs. high-dose.
Analyses performed with Column data
•Unpaired t test
•Paired t test
•Ratio-paired t test
•Mann-Whitney test
•Wilcoxon test
•Kolmogorov-Smirnov test
•Ordinary one-way ANOVA
•Brown-Forsythe and Welch ANOVA
•RM one-way ANOVA
•Kruskal-Wallis test
•Friedman test
•One sample t and Wilcoxon test
•Descriptive Statistics
•Normality and Lognormality Tests
•Frequency Distribution
•ROC Curve
•Bland-Altman
•Identify Outliers
•Analyze a stack of P values
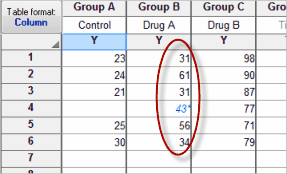
Example of a column table
•
•Each column defines a treatment group.
•Prism does not use a separate column to enter the grouping variable. Instead the groups are defined by columns.
•If data are not matched or paired, rows have no special meaning. Enter data in any order you like.
•If data are from a before-after experiment with clear pairing or matching, place each set of matched results on one row. Optionally, use the row title to label it.
•Blue italics values are “excluded” (ignored by analyses and graphs). Use Exclude Values.
Error bars
For one-way tables, Prism will calculate error values and create error bars automatically. Enter all the values for a data set in a single column.