Normalize the data to convert Y values from different data sets to a common scale. If you can't get Normalize to do what you want, take a look at the Remove Baseline analysis which can do some kinds of normalizing.
One example of where normalizing can be useful: Investigators who analyze dose-response curves commonly normalize the data so all curves begin at 0% and plateau at 100%. If you then fit a sigmoidal dose-response curve to the normalized data, be sure to set the top and bottom plateaus to constant values. If you've defined the top and bottom of the curves by normalizing, you shouldn't ask Prism to fit those parameters.
To normalize, click the Analyze button in the Analysis section of the toolbar. Then select Normalize from the "Transform, Normalize..." section of the analyses at the top of the list. Click OK which will bring up the Parameters: Normalize dialog.
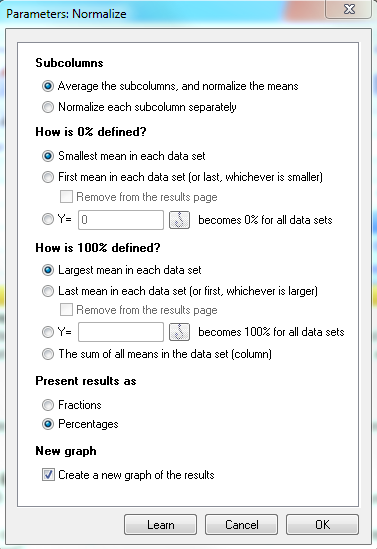
To normalize between 0 and 100%, you must define these baselines. Define zero as the smallest value in each data set, the value in the first row in each data set, or to a value you enter. Define one hundred as the largest value in each data set, the value in the last row in each data set, a value you enter, or the sum of all values in the column. Prism can express the results as fractions or percentages.
Notes:
•If you have entered replicate values, zero and one hundred percent are defined by the mean of the replicates. It is not possible to normalize each sub column separately.
•The X values are copied to the results table. They are not normalized.
•Each SD or SEM is normalized appropriately. Subtracting the baseline does not affect the SD. Dividing by the range does affect the SD, so the resulting SD values are the original values divided by the range (and maybe converted to a percentage).
•If you normalize to the smallest and largest value in the data set, you can remove those values (which would become 0.000 and 1.000) from the results.
•If your data are entered into subcolumns, you can normalize the means or separately normalize each subcolumn.