Many kinds of data combine a measurement (signal) you care about with a baseline or background (noise) you don't care about. You can analyze these data using two approaches. One approach is to perform analysis on the total signal. The other approach is to subtract or divide by a baseline or nonspecific value and then analyze and graph the results.
To access this analysis, start from the data table, click Analyze, then chose the analysis Remove Baseline and Column Math. If you can't find what you want in the analysis, take a look at the Normalize analysis which does similar calculations.
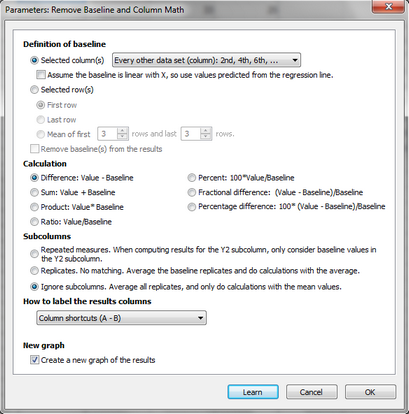
Definition of baseline
Depending on the experimental details, the baseline can be defined in (at least) three ways. Think this through before choosing this analysis in Prism. The baseline value for a particular value can be:
•A value, or the mean of several replicate values, in specified rows of the same column as the total value. Choose to define the baseline as the value in the first row, the last row, or the mean of a specified number of values in the first and/or last rows.
•A value (or mean of replicate values) in the baseline column of the same row of the table as the value from which the baseline will be subtracted (or divided) . So the baseline value for a value in row 13 of column B would be the value in row 13 of column A, or the mean of replicate values in row 13 of column A. Choose between a single column being the baseline values for all other values, or of having every other column be baseline vs. total.
If you check the option to assume a linear baseline, Prism performs linear regression using the X values as X and the background (nonspecific) values as Y. It computes a predicted Y value (from the line) at each value of X. Finally, it subtracts (or divides) this predicted baseline Y value. This method is appropriate when you know that the nonspecific or background values must be linear with the X values (for example nonspecific binding is often linear with ligand concentration), and is particularly useful when you have not collected baseline or nonspecific measurements at every value of X (Prism will fill in the missing nonspecific values from linear regression). When Prism fits linear regression, it does not assume that the line goes through the origin and does not display the regression results.
•The mean of all the values in (say) column A. You need to approach the calculation differently if you wish to define the mean (or median) of one column to be the baseline to subtract from (or divide into) all the other values,. You cannot accomplish this goal using Prism's Remove Baseline analysis. Instead, do two analyses of your data table. First do a Descriptive Statistics analysis to compute the column means. Then do a Transform analysis, and choose the transform Y = Y-K (or Y = Y/K). Hook the value of K to the mean of the column you wish to use as the baseline (usually the first column).
Calculation
The choices are self-explanatory. You can ask Prism to subtract the baseline, divide by the baseline, compute the fractional or percentage difference, etc. Note that you can also use this analysis to add or multiply two columns.