The navigator
The Prism Navigator tree on the left side of the Prism screen shows the contents of your Prism file.
|
•The five folders (Data tables, Info Sheets, Analysis Results, Graphs, and Layouts) define the five sections of a Prism project. You can not create more folders, and cannot create subfolders. •Each folder (section) can contain up to 500 sheets (pages). •Click on one of the folder (section) names to view thumbnails of all the pages in that section in a gallery. •Click on any sheet name to go to (view) that sheet. •Sheets can be highlighted in various colors. To do this, use the toolbar button or right click. •Results and graph sheet names in italics are frozen so won't update when the data are edited or replaced. •At the bottom of the list of sheets in each folder is a link for a new sheet of that type. Click to create a new table, graph, etc. •Above the navigator is a search box. •The current sheet (the one you are looking at) is highlighted. All sheets linked to that sheet (the family) are shown in bold. •Right click on a sheet name to rename, highlight, freeze, duplicate, etc. •Analysis sheets can spread the results over several analysis tabs.
|
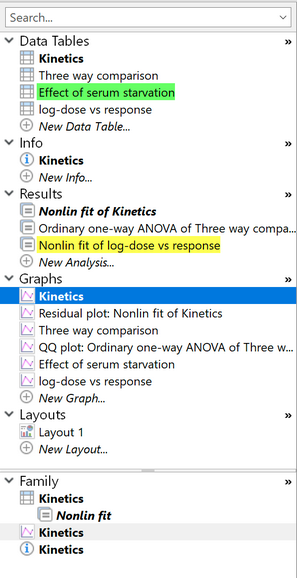
The Family folder
At the bottom of the navigator is a Family folder. It shows sheets related to the current one. Results are indented under the data they analyze. Analysis chains (first transform, then normalize, then fit a curve..) are shown by further indentations.
In some cases, sheets in different sections can have the same names. Distinguish them by the icons in front of each name which indicates the folder (section) it belongs to.
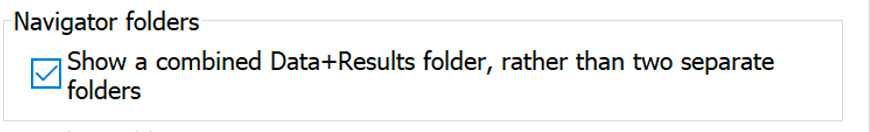
Separate folders for Data and Results or one combined Data+Results folder
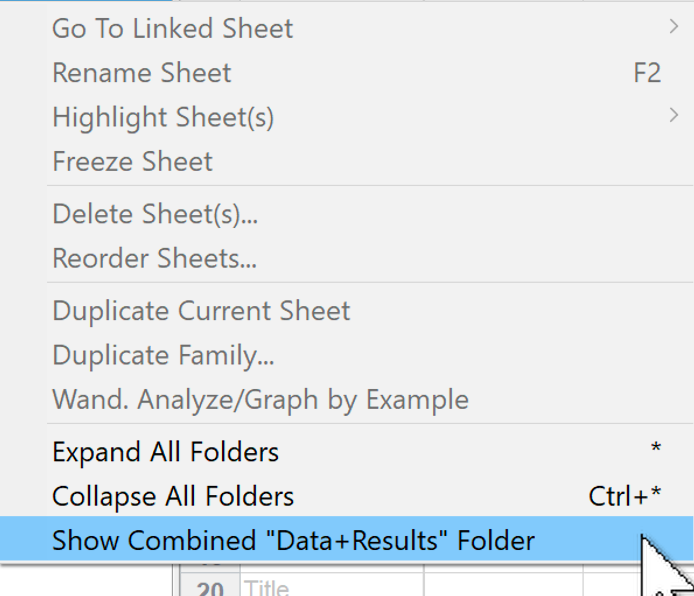
Starting with Prism 8.2, you can choose to have separate folders for Data and Results or a single combined Data+Results folder with results nested and indented so you can see which results came from analyzing which data set. Flip between the two ways of working in the View tab of Preferences or (easier) by right-clicking on the navigator. The bottom command on the shortcut menu switches between "Show Combined Data+Results Folder" and "Show Individual Data and Results Folders". The combined folder is pretty useful. It is worth trying.
Hiding the navigator
If you need more room to work, click the button in the lower left corner of the Prism window to hide the Navigator. Click it again to bring the Navigator back.

See also:
Tips for navigating large project