KNOWLEDGEBASE - ARTICLE #1213
Creating a graph with only a right Y axis, and no left Y axis.
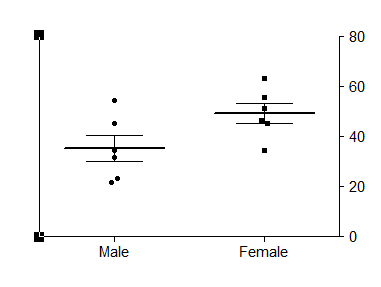
This example shows how to create a graph with just a single Y axis on the right side of a graph
How to do it:
Prism was designed so the right Y axis is a second axis you can optionally add to a graph. But what if you only want one axis, and want to put it on the right side of the graph? You can't show only the 'right' axis and hide the 'left' axis. Prism just won't let you do that. When Prism makes a graph with one Y axis, it calls it the 'left' Y axis. But you can place that axis wherever you want, including the right edge of the graph. Follow these steps:
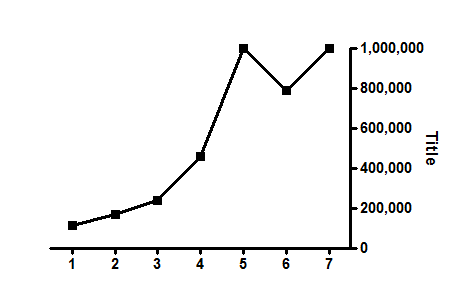
XY graphs
- Double click on the left Y axis to bring up the Format Axis dialog.
- Go to the right Y axis tab, and make sure the first drop down is set to "No right Y axis".
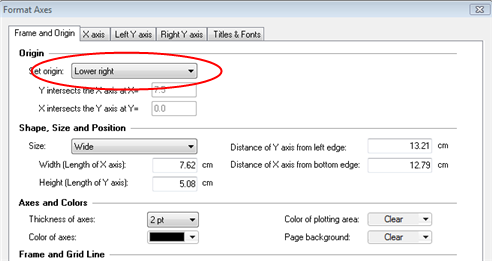
- Go to the first tab, Frame and Origin.
- Set the origin to the lower right corner (or perhaps upper right).
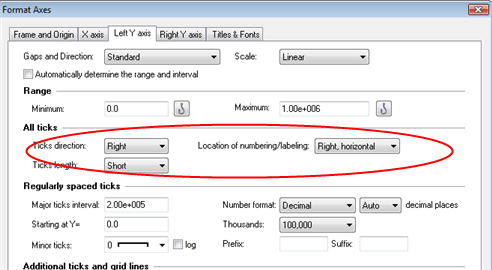
- Go to the Left Y axis tab, and change the location of the numbering to the right side of the axis. Prism may have done this for you automatically. Also adjust the direction of the ticks.
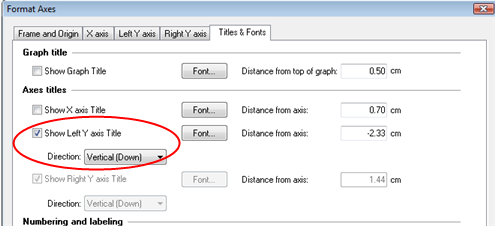
- Go to the last tab, Titles and Fonts. Change the direction of the Left Y axis title to "Vertical (Down)"
- Remember that Prism still thinks of the axis as being the left Y axis, so leave data sets (in Format Graph) assigned to the left Y axis.
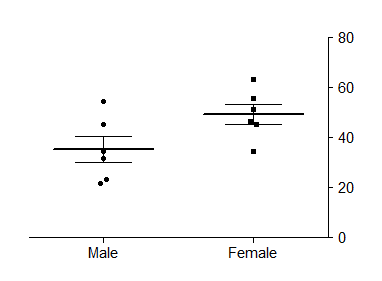
Column graphs
This approach won't work with column graphs with only one data set. For this situation, follow these steps:
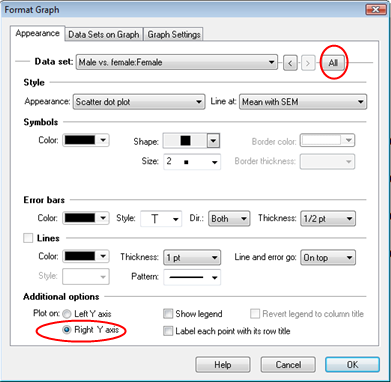
- Double click on the graph and assign the data set to the right Y axis. Click the All button first to select all data sets on the graph.
- Double click on the right axis, and adjust its range, ticks, numbering position, etc. as needed.
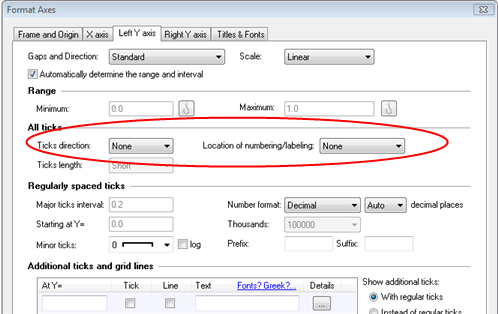
- Double click on the left Y axis and turn off its numbering and ticks.
- Go to the graph and click once on the left axis to select it.
- Drop the Change menu and choose Selected Object
- Set the color of the object (the left axis) to white (or whatever color matches your page background).
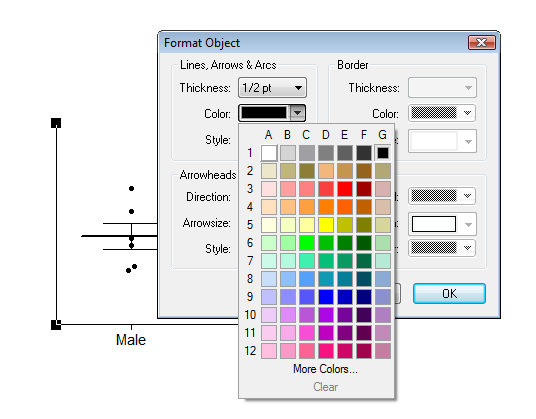
- The axis won't be deleted but will be invisible.