
Plotting t, z, F, or chi-square distributions with Prism.
GraphPad Prism can generate probability distributions. This demonstrates Prism's ability to plot functions from user-defined functions, and also the use of hooking info constants to analyses.
Download this Prism file to generate and plot the graphs shown below.
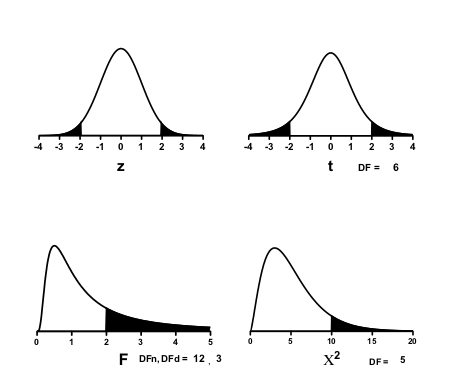
In each case, the simulation generates two (or three) data sets. The first (A) data set plots the entire curve. The second (and third) data sets only plot values where X is greater than (less than) a specified cutoff value. This second (and third) data set are plotted with area fill to shade the tails of the distributions. Remove data set B or C from the graph if you only want to shade one tail.
Change the numbers of degrees of freedom and the cutoff values (for shading) in the Info sheet. This demonstrates how values entered into an info sheet can be 'hooked' to constants used in analyses.
Keywords: F distribution, t distribution, z distribution, normal distribution, chi square distribution, statistical distributions, tail, tails, student t, X2, statistical function, plot z, plot t, plot F, graph statistical distributions,