
KNOWLEDGEBASE - ARTICLE #1336
Graphing a Binomial or Poisson distribution with Prism.
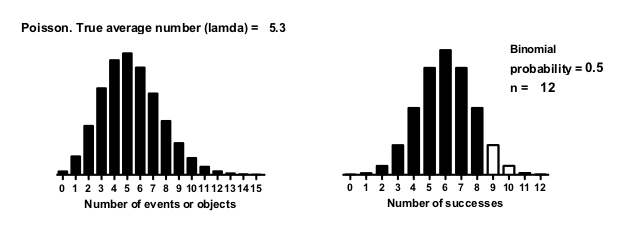
Prism can graph a Binomial or Poisson distribution. Download the file that generated this pair of graphs.
To modify this file, change the value of lamda (for Poission) or the probability, n, and cutoff (Binomial) in the Info sheet. Enter new values there, and the graph updates. This is a good example of the usefulness of hooking an info constant to an analysis.
If you want to recreate graphs like these, keep in mind these points:
- As its name suggests, the analysis 'Create a Family of Theoretical Curves' is usually used to create curves, not bar graphs. When you choose the range of X values, specify the appropriate number of 'line segments' (points) so that the X interval equals 1.0. The binomial example on the left created 16 'line segments' starting at X=0 and ending at X=15. The Poisson on the right created 13 'segments' with X starting at 0 and ending at 13.
- The analysis will create a set of line segments (an attempt to create a curve). Click the change type of graph button, or drop the Change menu and choose Graph Type. Then choose the Grouped tab, and then choose interleaved bars.
- The binomial example on the right has two data sets. You don't want them plotted interleaved, as selected in the previous step. Double click to bring up Format Graph, then go to the middle tab, and choose to superimpose the second data set on the first (rather than interleave). And assign it a different color.
Keywords: binomial distribution