
Those values are not outliers! They are the tail of a lognormal distribution.
The Grubbs' and ROUT outlier tests are both based on the assumption that the data, except the potential outlier(s), are sampled from a Gaussian distribution.
But what if the underlying distribution is not Gaussian? Then the outlier tests are misleading. A common situation is sampling from a lognormal distribution.
The graph below shows four data sets sampled from lognormal distributions.
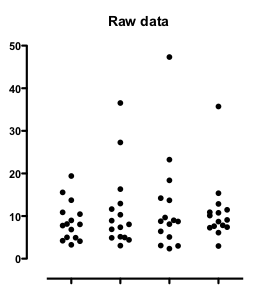
Three of those data sets seem to include an outlier, and indeed Grubbs outlier test found an outlier in three of these four data sets.
But these data are not sampled from a Gaussian distribution with an outlier. Rather they are sampled from a lognormal distribution. Transform all the values to their logarithms, and the distribution becomes Gaussian:
![]()
The apparent outliers are gone. Grubb's test finds no ouliters. The extreme points only appeared to be outliers because extreme large values are common in a lognormal distribution but are rare in a Gaussian distribution. If you don’t realize the distribution was lognormal, an outlier test would be very misleading.