Why do many data points lie outside the regression confidence bands?
When you fit linear or nonlinear regression with Prism, you can choose to also plot confidence or prediction bands. This choice is on the Linear regression dialog, and on the Diagnostics tab of the nonlinear regression dialog.
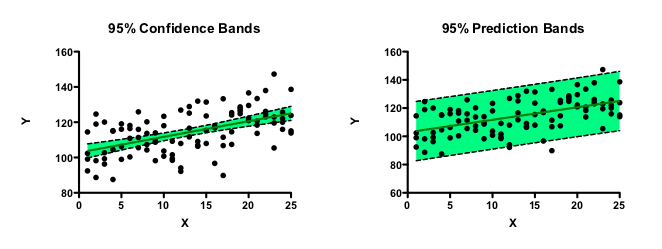
Confidence bands show you how well you know the location of the best fit line or curve. Given all the assumptions of the analysis, you can be 95% sure that the true curve (nonlinear regression) or line (linear regression) lies within the bands.
Prediction bands show you where you can expect the data to lie. You expect 95% of all data points to lie within the prediction bands.
With many data points, you expect a large fraction of the data points to lie outside the confidence band, but 95% to lie within the prediction bands. The confidence bands aren't supposed to show you the scatter of the data, but rather the uncertainty in the position of the line or curve. With lots of data, the line or curve is known fairly precisely, so only a small fraction of data lie within the bands.
The figure below demonstrates this with linear regression.