
Will the real "logistic" please stand up. The three meanings of "logistic".
Much of the battle when learning statistics is understanding terminology. The terms logistic is confusing because it has three meanings which have little relationship to each other. Cramer reviews the history (J.S. Cramer. The origins and development of the logit model. Chapter 9 of Logit models from economics and other fields, Cambridge University Press, 2003).
Logistic population growth
The term "logistic" was first invented in the nineteenth century to describe population growth curves, or the progression of an autocatylitic (chain) reaction. The idea is pretty simple. Population growth is limited, so can't ever exceed some value we'll call Nmax. The rate of change of population at any time t is proportional to the number of individuals alive at that time (Nt). But population growth slows down as it reaches the maximum, so is also proportional to (Nmax - Nt). So the rate of change of population is proportional to Nt(Nmax - Nt).
Integrate that differential equation, and the result is called a logistic equation. Details here. It defines a sigmoidal shaped curve that defines the population at any time. The model has three parameters: the starting population, the maximum population, and the time it takes to reach half-maximal. Sometimes it is modified to add a fourth parameter to define the steepness of the curve:
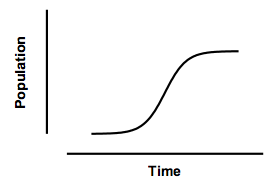
This curve was used by demographers in the past, but really doesn't do a very good job of describing the growth of human populations. It is useful to model the growth of tumors, and to model the fraction of a population that uses a new product (like mobile phones).
This model is also used for autocatalytic reactions, where the product of the reaction is also a catalyst for that reaction. With this kind of reaction, the rate of product accumulation is proportional to the concentration of product already produced times the concentration of remaining substrate. This has the same mathematical form as the population growth model. The graph is identical to the one above, except the Y-axis would be the concentration of the product produced by the enzyme reaction (instead of population).
"Logistic" dose-response curves
Bindslev reviews the history of the many equations used to describe dose response curves, in Hill in Hell (pdf), Chapter 10 of his text, Drug-Acceptor Interactions.
A common equation, based on work by Hill, defines a response as a function of the minimum response, the maximum response, the concentration required to evoke a response half-way between the minimum and maximum (the EC50), and a parameter that describes how steep the curve is. In Prism, this equation is called the log(agonist) vs response curve -- Variable slope (four parameters).
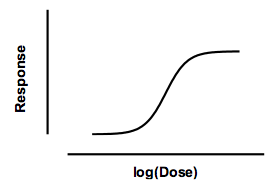
Response at any dose is defined by an equation wtih four parameters: minimum response, maximum response, the log(EC50), and the slope factor (also called the Hill slope). Surprisingly, this equation has the same mathematical form as the logistic equation describing population growth, even though the two uses are entirely different. For this reason, the dose-response equation is sometimes called a "logistic" equation. Since there are four parameters, it is sometimes called the four parameter logistic equation, abbreviated 4PL.
This dose-response model describes many systems, but it is purely empirical. It does not correspond to any molecular model (except, perhaps, when the Hill slope is an integer).
Differences between logistic kinetics and logistic dose-response models
There really is no connection between the use of a logistic equation to describe population growth, and its use to describe dose-response curves.
| Population growth | Dose-response | |
| Independent (X) variable | Time | log(Dose) or log(Concentration) |
| Source of equation | Theory | Empirical |
| Logarithm? | Logarithms are not used. | X axis has logarithmic scale |
Logistic regression
The third use of the word logistic is logistic regression. This is a multiple regression method used when the outcome has two possible outcomes.
The point of the equation is to predict the probability, P, of an outcome from a set of independent variables. To create a model that always predicts a value for P that is between 0 and 1 the logistic regression model actually predicts the logarithm of the odds (review odds vs. probabilities). The natural1 logarithm of the odds is also called the logit function (pronounced with a long O and a soft G).
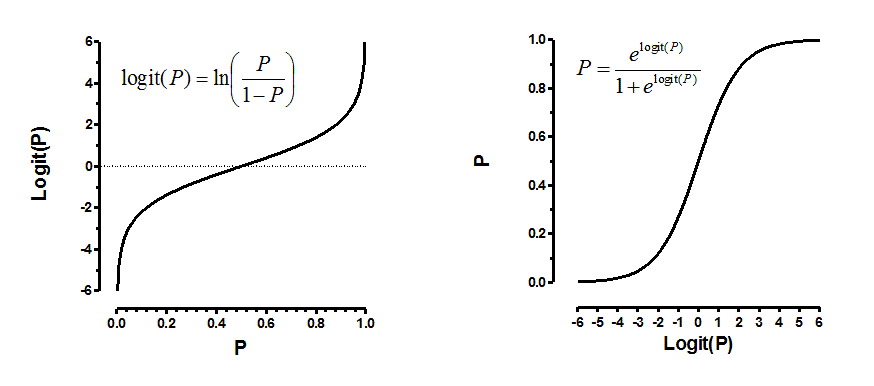
P is a probability, so always has a value between 0 and 1. Odds are defined as a probabiility divided by one minus that probability. The logit function is the natural logarithm of the odds. The logit of 0.5 is 0. The logit of any P between 0 and 0.5 is negative, and the logit of any P between 0.5 and 1.0 is positive.
The logistic regression model predicts logit(P) as a function of multiple independent variables (X1, X2, ...) and multiple parameters (b1, b2, ...):
logit(P) = b0 + X1b1 + X2b2 ...
Logit(P) can take on any value (negative or positive) and the corresponding P is always between 0 and 1. Logistic regression is widely used to analyze clinical studies and in social sciences. The important point here is that this use of the word logistic is completely distinct from the use of the word logistic to describe a population model or a dose-response model (explained above). Here the word logistic is used because the regression uses the logit function. In contrast, the logit function is not needed in modeling population growth or dose response relationships.
------
1. Logarithms to the base e are only natural to mathematicians. Most scientists are more comfortable with base 10 logarithms. The base 10 logarithm of an odds (a base 10 version of the logit function) is called the LOD score.
2. Download the Prism file which created the three graphs above.