
Linear or nonlinear regression with two (or maybe three) independent variables.
Prism is designed to perform nonlinear regression with one independent (X) variable. But, with a bit of cleverness, it is possible to also fit data with two independent variables.
Fitting a family of curves
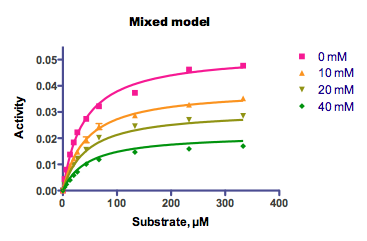
This example shows how to fit a family of curves. Here, each curve shows enzyme activity as a function of substrate concentration. The curves differ by the presence of various amounts of an inhibitor. There are, essentially, two independent variables: substrate concentration, and inhibitor concentration.
Fitting data where each value has two independent variables
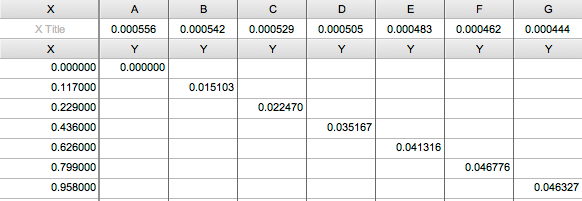
But what if each value you collect has two independent variables? You don't have a family of curves. Rather you have one set of Y values, each associated with two X variables. Follow these steps to enter the data:
- Create an XY data table, with whatever form of subcolumns fits your data.
- Enter the first Y value in row 1 of column A.
- Enter the first independent variable corresponding to that Y into first row of the X column.
- Enter the other independent variable for that first Y value as the column title of column A.
- Enter the second Y value in row 2 of column B.
- Enter the first independent variable for that Y into the second row of the X column.
- Enter the other independent variable for that Y as the column title of column B.
- Continue with the rest of the data. You'll be entering data diagonally down the table. Since Prism can only have 104 columns, you will be limited to 104 data points, each with a Y value and two X values.
- When you are done, you'll have the same number of rows as Y columns.
When you fit the data, keep in mind the following:
- "X" refers to the values you enter into the X column. Use some other name ("X2" or whatever you want) for the other independent variable.
- In the constraints tab, define that parameter to be a data set constant equal to the column title. You don't want Prism to fit that parameter, but rather to get its value from the column titles.
- For all other parameters in the model, use the Constraint tab to share the value among data sets. Prism sees each column as a data set. In this data table, each data set has only one value so Prism can't possibly fit anything unless all the parameters are shared.
Prism will report the nonlinear regression results clearly. All the results you want will be in the final "global" column. Prism cannot graph the results since each data set has only one point, and Prism cannot plot 3D graphs.
Download this file which shows a simple example of multiple nonlinear regression.
Three independent variables
Prism is not really designed to fit models with three independent variables, but you can get it to do so in some circumstances.
Enter your data as above, with one independent variable as X and the second as column titles. Make sure each column of data has only one value for the third independent variable. Then define that third variable in a user-defined equation. Let's imagine that the third variable has the name Z. Add syntax like this to your equation:
<A> Z=2.34
<B> Z=45.34
<C>Z= -23.4
<D>Z=12.45
That tells Prism to assign Z one value for column A, a different value for column B, etc.
Keywords: multiple nonlinear regression, enzyme inhibition