
Two methods of calculating multiple comparison tests after repeated measures one way ANOVA.
After repeated measures one-way ANOVA, it is common to perform multiple comparison tests. This page explains that there are two approaches one can use for such testing, and these can give different results.
Basis of the two methods
The computations are done by computer, so there is no reason to learn the details. But you have to learn a bit about how multiple comparisons tests are computed in order to understand the distinction between the two alternative methods.
Before starting with multiple comparisons calculations, you need to define which comparisons you want to make. This decision should be made before collecting any data. Prism only deals with multiple comparisons that compares one treatment (column) with another. It is possible to do fancier comparisons (is the average of these two treatments distinct from the average of those three treatments?) but we won't discuss these kinds of comparisons (also called contrasts).
When comparing one treatment with another in repeated measures ANOVA, the first step is to compute the difference between the two values for each subject, and average that list of differences. The next step is to divide that mean by a standard error. We'll come back to that. Then the final step is to compare that ratio (mean divided by SE) to some critical value. The critical value is based on the number of comparisons you are making, the number of subjects in the study, the desired significance level (which applies to the entire family of comparisons), and the choice of multiple comparisons method (Bonferroni, Tukey, Dunnett, etc.). Read details of computing this ratio for ordinary (not repeated measures) ANOVA.
Calculating the standard error of the difference is where there are two possible methods for handling repeated measures data:
- The traditional method is to compute the standard error of the mean from the Residual Mean Square (shown in the ANOVA table) and the sample size. This uses data from all the groups to compute the standard error, and so is analogous to the method used for multiple comparisons after ordinary (not repeated measures) ANOVA.
- The alternative method is to compute the standard error from only the two groups being compared. You've already computed the list of differences to compute the mean difference. Compute the standard error of the mean from this list. Up to the point of interpreting the ratio, this is exactly the same as performing a paired t test on just the two groups being compared and ignoring the other groups.
Pros and cons of the two methods
The first method (use all data):
- Uses data from all the data, and thus has more degrees of freedom. There are [n-1]*[k-1] degrees of freedom, where n is the number of subjects (rows), and k is the number of treatments (columns).
- Is analogous to the method used for ordinary ANOVA.
- Can give misleading results if the assumption of sphericity is not true.
- Has more power if that assumption is true, especially with small data sets.
The second method (use only data from the two columns being compared):
- Does not assume sphericity.
- Is identical to a paired t test. Calculation of the t ratio is identical. Deciding upon statistical significance is not the same, as it accounts for multiple comparisons.
- Has fewer degrees of freedom, equal to n-1, where n is the number of subjects (rows).
- Analyzes only a subset of data, so has less power than the first method if the assumption of sphericity is true, especially with small samples.
- Is much simpler to understand and explain.
Few statistical texts say much about multiple comparisons following repeated measures one-way ANOVA. Maxwell and Delaney (reference below) recommend the second method if there is any doubt about the sphericity assumption. David Howell has written a terrific web article on this topic. He strongly recommends the second method. That short article (lecture handout) makes a number of other great points, and I recommend it highly.
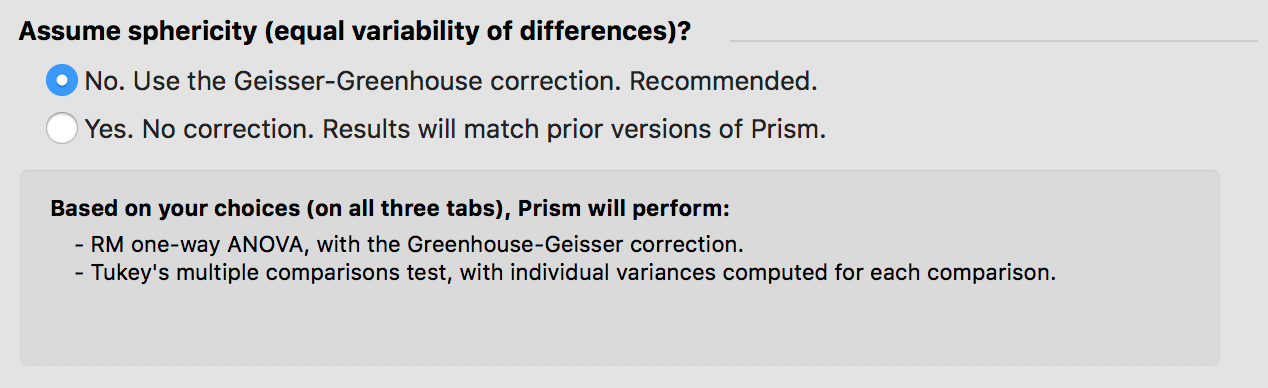
Version 7 of Prism added the ability to do the multiple comparisons using either approach with one-way ANOVA (but not yet two-way ANOVA). You choose whether or not to assume sphericity. If you assume not to, then Prism uses the second method explained above to do multiple comparisons.
The second method with Prism 5
Prism 5 calculates the first method as part of the one-way ANOVA analysis. If you want to use the second method with Prism 5, you'll need to do a bit of extra work.
Run a separate paired t test for every pair of groups you plan to compare, and record the P value from each. Then use the Bonferroni method to adjust the significance level. For example, if you want the family wise significance level to be 0.05 and you are making ten distinct comparisons, then set the threshold for defining significance to be P<0.05/10, which is P<0.005. If any of the P values are less than that threshold, define that threshold to be statistical significant at the 5% level with accounting for multiple comparisons. Note the confusing point. The threshold for defining significance is alpha/m, where alpha is the family-wise significance threshold you want to use (often 5%) and m is the number of comparisons. So in the example, significance for the family is defined at the usual 5% level even though each comparison is declared to be statistically significant only when its P value is less than 0.005.