
What are the consequences of choosing the wrong weighting method in nonlinear regression?
When fitting a curve with nonlinear regression, one of the choices is to pick a weighting method. If the scatter among replicates is expected to increase as Y increases, the usual method of minimizing the sum-of-squares is not appropriate. Instead, you should pick a weighting method to minimizing the weighted sum-of-squares. This removes excessive weight from the points with large Y values and so equalizes the expected contribution of all points.
What happens if you leave the choice on the weighting tab set to its default -- no weighting -- when the scatter is actually related to the Y value? Of course, the answer is "it depends"? It depends on how large the scatter is, and how large a range the Y values span. The rest of this article looks at one example, and simulates many data sets to see what happens when the fitting is done inappropriately.
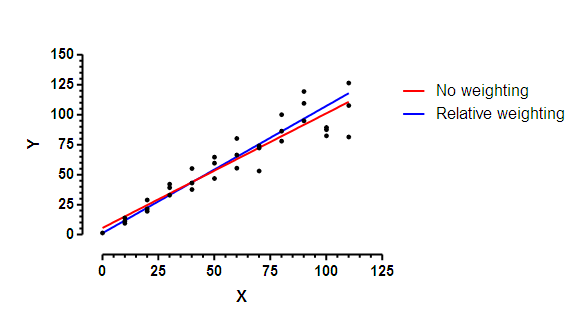
I picked a very simple model -- a straight line. I simulated the data so the SD of scatter at any point along the line is proportional to the Y value of that point. The graph below shows a simulated data set. You can clearly see that the scatter among replicates increases as the line goes up.
The line was fit to the data by "nonlinear" regression. Prism does not offer differential weighting as part of its linear regression analysis, but "nonlinear" regression can fit a straight line and offers many options in Prism, beyond those available in linear regression.
The red line used the default choice -- no weighting; minimize sum of squares. The blue line used relative weighting. This choice is appropriate when you expect the SD of replicate residuals to be proportional to Y. The two lines are not identical.
I simulated 5000 such data sets using the Monte Carlo analysis of Prism 6. Each of the 5000 simulated data sets was fit with both unweighted and weighted (relative weighting) regression. I recorded both the best-fit value of the slope and its standard error (SE) for both analyses of each of the 5000 data sets.
 Sim
Sim
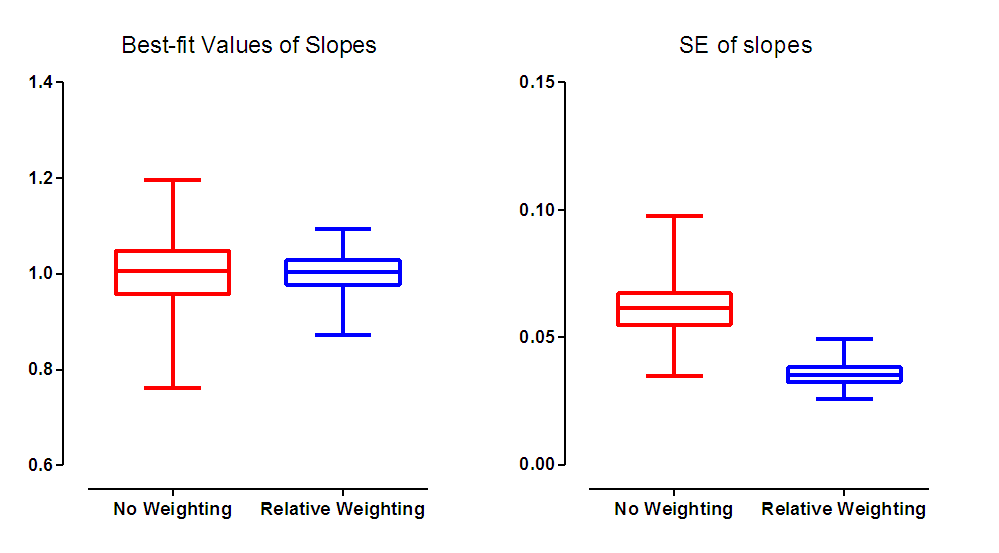
The scatter among replicates was proportional to Y, so relative weighting is appropriate. The results of these simulations are shown in blue. The results in red show the results when the regression used equal weighting (the default). The boxes extend from the 25th to the 75th percentile, with a line at the median (50th percentile). The whiskers extend down to the smallest value and up to the largest.
The left graph above shows the distribution of the best-fit values of the slopes. There is no reason to think that using the wrong weighting scheme would systematically result in a best-fit value of slope that is too high (too steep) or too low (too shallow). Indeed, the median best-fit values for slope are almost identical for the no-weighting and relative-weighting fits. But note that the results with no weighting has a much broader spread of slopes. Since these are simulated data, we know the true slope (1.0) and can quantify how far the best-fit slope is from that idea for each simulated data set. The median error when the data were fit without differential weighting (red) was 0.04610, compared to 0.02689 for the simulations with relative weighting (blue).In this example, choosing the wrong weighting scheme increased the median error by 71%.
Each of the 5000 simulated data sets was analyzed by regression, and the regression results include the SE of the slope. The graph on the right above shows the distribution of these SEs. The graph on the right shows that the reported SE of the slope is much higher when the fits were done with equal weighting for all points. The median SE for the unweighted fits was 73% larger than the median SE for the weighted fits. Since the width of the confidence interval is proportional to the SE, this means the median confidence interval was 73% wider when the fits were done without weighting.
Since these are simulated data, we know the true population slope (it is 1.0). So we can ask for each simulation whether the reported 95% confidence interval included the true value. For the relative weighting simulations, the 95% confidence intervals included the true value in 95.3% of the simulated data sets. When those same data sets were analyzed without weighting, only 92.6% of the "95%" confidence intervals included the true value.
In summary, when we chose the wrong weighting scheme in this example:
- The best-fit value of the slope was less precise.
- The SE of the slope was larger, and thus the confidence intervals were wider.
- Even though the 95% confidence intervals were wider, they weren't wide enough. The "95%" confidence interval only included the true value in fewer than 95% of the simulations.
This is just one example. With other examples, the choice of weighting method matters less. But with still other examples, it may matter more. It is worth trying to choose the appropriate weighting scheme.