Don't use weighted nonlinear regression with normalized data.
When fitting a model to data with nonlinear regression, it is often very helpful to use weighted nonlinear regression. This page explains the dangers of first normalizing data and then using weighted regression.
The sample data sets
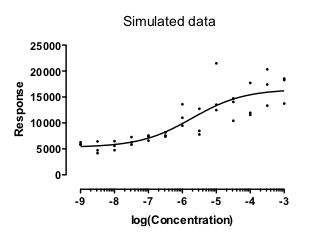
Here is a set of simulated data. I simulated the data so the SD of the Gaussian scatter was proportional to the predicted Y value. When the Y value was twice as large, the SD of the distribution from which the random error was simulated was twice as large. This is an option in Prism's simulate dialog.
Fitting the data using weighted regression
These data fit nicely with weighted nonlinear regression, minimizing the relative distance squared.
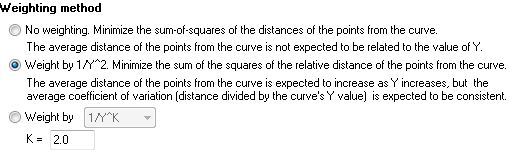
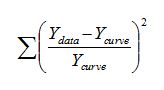
With this choice, Prism minimizes the quantity defined by the equation below, where Ydata is the experimentally observed Y value, and Ycurve is the predicted Y value (at the same X value) that defines the curve.
I used the new Monte Carlo analysis of Prism 6 to simulate and fit 1000 such data sets. Prism was able to perform a weighted fit on all 1000 simulated data sets, and the logEC50 was within the range of the data in every case.
When fitting experimental data, of course, you never know if a confidence interval includes the true population value or not. With simulated data, you know the true population value so know whether a 95% confidence interval includes that value. When everything works as it should, you expect that 95% of the 95% confidence intervals will include the true population value and that 5% will not. That is exactly what happened here. In 95.3% of those simulations, the reported 95% confidence interval for the logEC50 included the true value (-6).
No surprise so far. The data were fitting assuming a model that exactly matched the method used to simulate the data, and those fits worked well.
Normalizing first
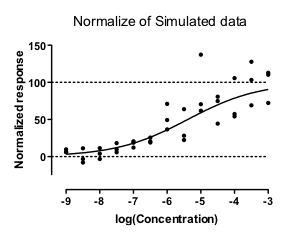
People often like to normalize dose-response data so the Y values range from 0% to 100%. What happens if the data are normalized before they are fit?
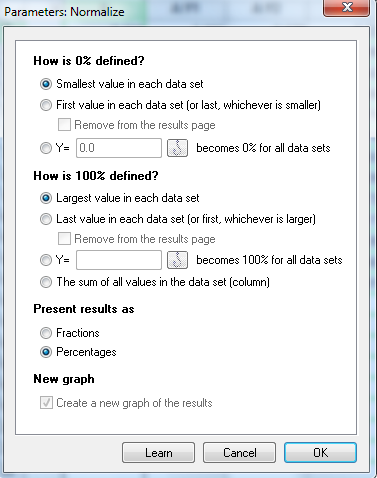
Prism offers a Normalize analysis, and I used it to normalize each of the simulated data sets.
That analysis first computes the mean of the replicates (triplicates in this example) at each concentration. It then defines Z (the value that will be defined to be 0%) to be the smallest of those means, and H (the value that will normalize to 100%) to be the largest of those means. Usually, Z is the mean response at the smallest concentration, and H is the mean response at the largest concentration. It then normalizes each triplicate value using the equation (Y - Z)/(H - Z). Because H and Z are based on means of triplicates, some individual values may normalize to a value lower than 0%, and some individual values can normalize to a value greater than 100%.
I then fit these normalized data, constraining the curve to run from Y=0 to Y=100. I used the same relative weighting as before.
I then ran a Monte Carlo simulation to analyze the same 1000 data sets, again using weighted fitting to fit the normalized data. The results were:
In summary, using weighted nonlinear regression to fit normalized data worked really poorly. In many cases, the method didn't generate any curve. In others, the curve was really bad.
Why doesn't weighted fitting work with normalized data?
The weighted fit makes sense when the SD among replicates is proportional to the Y value of the curve. This is the case with the original simulated data. Accordingly, the weighted fit works exactly as it should.
When you normalize the data, the scatter is no longer proportional to Y value of the curve. Since the assumption of the weighted fit is incorrect, it is not surprising that the weighted fit works so poorly.
Here is an easy way to see the problem:
With the first simulated data set, the Y value of the best-fit curve at X = -4 is 3.05 times larger than the Y value of the curve at X=-8. Since the weighting is proportional the the Y value of the curve squared, the points near the top of the curve (at X=-4) get 3.052 , or 9.28, times as much weight as points near the bottom of the curve (at X=-8).
The situation is very different with the normalized data. With the first simulated data set, the Y value of the best-fit curve at X = -4 is 17.77 times larger than the Y value of the curve at X=-8. Since the weighting is proportional the the Y value of the curve squared, the points near the top of the curve (at X=-4) get 17.772 , or 315.8, times as much weight as points near the bottom of the curve (at X=-8). Since the points at the top of the curve gets so much more weight that those at the bottom, those at the bottom are essentially ignored, making the entire curve fit not work very well. Since the normalization forces the curve to go down to 0.0, in some simulated data sets, the ratio of the Y curve values at the top to its value bottom will be even larger.
Bottom line
Download the Prism file (requires Prism 6).