
How can I put differently colored/shaped symbols together in the same column of a column scatter graph ("dot plot")?
When you make a column scatter graph with Prism, all symbols in each column have the same shape and color. It is possible to make some points have a different color. The details depend on the Prism version.
Prism 6:
- Select a range of data, perhaps one row or one subcolumn.
- Right click, choose Format Points, and then Symbol color
Notes:
- If you have more than one graph from the same data, Prism will ask whether you wish to change one or all graphs.
- If you have an XY table and the X column is entirely blank, then the Format Points command will be gray. The workaround is to change your table to a Column table.
- There is no way to create a new legend using this method to explain what the colors mean.
Prism 5, or Prism 6, when you just want one or a few points to have a different color:
- Make a column scatter graph as usual.
- Right click on a point, choose Format This Point, and choose a different color.
- Repeat for each point you wan to change.
Prism 5 or 6, when you want many points to have a different color or you want to create a legend for the colors.
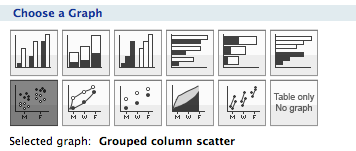
1. Create a Grouped data table, and choose a Grouped Column Scatter graph.
2. Enter data on a Grouped data table, rather than a Column table. See this example:

The graph will look like this:
.png)
Note two bugs in Prism 5:
- If the Y axis is discontinuous (has a gap), the graph will look ok, but the line at the grand mean will not be at the correct spot (for any columns where some values are on each side of the discontinuity).
- If the axis is set to have a logarithmic scale, the line at the "grand mean" will actually be at the grand geometric mean.
Also see this example of how to make before-after graphs with different symbols for different subjects.
Prism 4
To place points with colors in one column, you need to make an XY graph instead of a column graph. You don't really have a X variable, but can use the X coordinates to position the points horizontally. The Y coordinates are separated into different columns according to the symbol you want to be used for each point. Remember the rule in Prism--one kind of symbol(color, shape..) per data set. Study the following example:

Since this is a work-around rather than a conventional column scatter graph, Prism won't add the lines denoting your means.
In this example, all the points in each group have exactly the same X value (1.0 or 2.) so the points are aligned. You could also enter slightly higher or lower X coordinates (maybe 0.9 or 1.1) for some points to jigger the points to the right or left to avoid overlap.
Keywords: scattergram grouped scatter plot two grouping variables two way