
Why is my column scatter plot missing some points? Why is there an extra point?
Missing points
If you have too many points on a column scatter graph with exactly the same Y value, Prism starts superimposing them, so you can't see how many there are. There are three ways to bypass the problem:
- Drag the baseline to widen the graph
- Make the symbols smaller
- Make the gap between columns smaller, allowing more room for symbols
Adjust items 2 and 3 in the "Format Columns" dialog, which appears when you double-click on a symbol.
We have improved the way Prism arranges points in scatter plots in releases 5.04 (windows) and 5.0d (mac).
Extra point
In very rare circumstances, Prism can show an extra point on a scatter plot at the mean or median of all the points. This problem occurs during "magic" (Make Graphs Consistent). If the example graph shows a line at the mean or median, the graph being changed might end up showing a symbol there instead of a line.
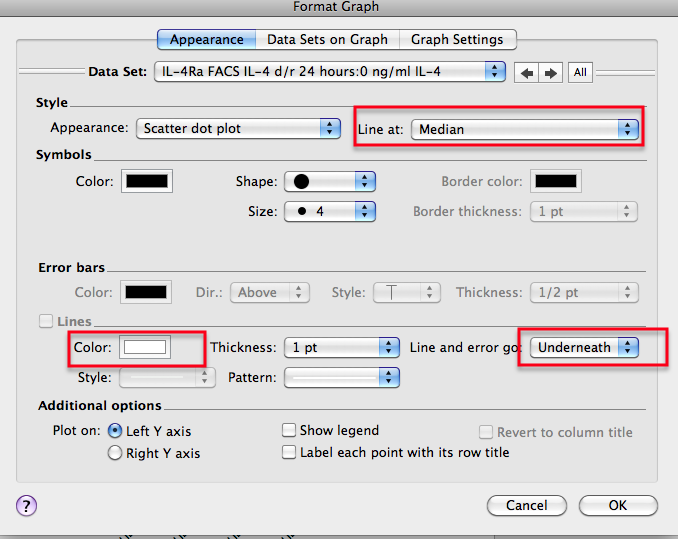
When this happens, there is an easy workaround: Double-click to bring up the Format Graph dialog, drop the "Line at:" menu, and choose any choice different than the current one. Click OK in the dialog, and the "extra" point will disappear. Double click again, and bring that setting back to the original one, and the graph will look fine. The "extra" data point will not come back.
This problem was fixed in 5.04 and 5.0d.
Prism Mac 5.0d has a related problem. When you switch from plotting a line at the mean or median to plotting no line, Prism can show a point (circle) at the mean or median. Here are two ways to bypass the problem:
- Make a new graph, and specify when making the graph that you want no line at the mean or median. The bug only occurs when you start with a line and then take it away.
- Accept that Prism will draw the line, but make it effectively invisible by setting it to white (or whatever background color you use) plotted under the data points.
Keywords: bug