
Fitting dose-response data that are sigmoidal when X is concentration, rather than log(concentration)
Dose response curves
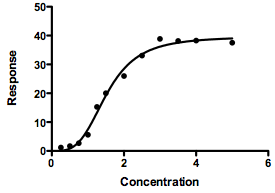
The dose-response curve equations built in to Prism are all written assuming that X is the logarithm of concentration. This makes sense, because the common situation is that dose-response curves look sigmoidal (and usually symmetrical) when X is the logarithm of dose or concentration. However, in rare cases the dose-response curve is sigmoidal (and perhaps symmetrical) when the X value is concentration, rather than log of concentration.
To fit such a curve, here is an equation to try:
Y=Bottom+(Top-Bottom)*x^n/(Ka^n+x^n)
This is a modification of the usual one-site binding equation (rectangular hyperbola), except X and Ka are raised to the nth power. The parameter Ka is the EC50, the concentration that provokes a response halfway between Bottom and Top.
As written, that equation includes the parameter Bottom, which is the bottom plateau of the curve. If you know the response must equal zero wen the concentration is zero, then constrain Bottom to equal 0.0 as in the example above.
This equation will only have a sigmoidal shape if n is greater than 1.0. If you constrain n to equal 1.0, then the resulting curve will be a hyperbola (like a Michaelis-Menten curve) rather than sigmoidal.
Other sigmoidal curves, when X is not dose
Sigmoidal shaped curves appear in other situations, where X is not dose. One example is the curve that relates the volume of the lung to the pressure within it.
.png)
One model to fit these data is: Y = a + (b/(1 + exp(-(X - c)/d))), where: