
Bugs in computing the 95%CI of the X intercept.
Incorrect results reported when Y replicates were entered
When you enter replicate Y values, Prism should take these into account when it computes the confidence interval of the X intercept. But it mistakenly did the calculations using the number of X values (with Y values entered), rather than the total number of Y replicates entered. This makes the reported confidence interval of the X intercept wider than it should be. The severity of the bug depends on the number of replicates you entered (the discrepancy is worse with more replicates).
Prism 4 and 5 compute and plot the confidence band of the regression line correctly. The confidence interval of the X intercept is defined be the intersections of the two confidence bands with the X axis (at Y=0). The problem is that the confidence interval reported will not match that visual rule.
Here is an easy work around: Run a row statistics analysis to create a table with mean, SD (or SEM) and N. Then fit linear regression to that table, The linear regression results will be identical, except for the confidence interval for the X intercept, which will now be correct.
This bug is fixed in 5.02 (Windows) and 5.0b (Mac).
Nonsense values when the confidence interval is actually undefined
With some data sets, the confidence interval for the intercept is simply not defined.
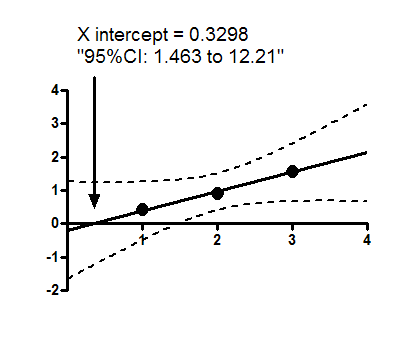
The example above shows the best-fit linear regression line along with the 95% confidence band. Note that the upper confidence band never crosses the Y=0 axis. This means that the lower 95% confidence limit for the X intercept is simply not defined. Prism 4.00 mistakenly reported the confidence interval as the two places where the lower confidence band crosses the Y=0 axis. These crossing points are both to the right of the X intercept, so make no sense. Fixed in Prism 4.01 and 4.0b.