
R2 of unpaired and paired t test results.
R2 for unpaired t test computed using linear regression
Prism, unlike most statistics programs, reports a R2 value as part of the unpaired t test results. Other programs and books call this eta squared.
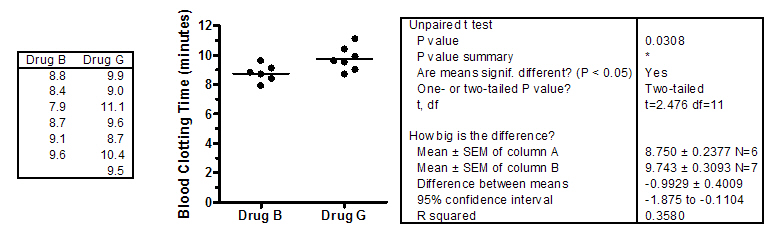
To understand how to interpret this value, it helps to first look at an unpaired t test as a problem in linear regression. Here are a sample data set with the t test results (example 8.1 from Zar, Biostatistical Analysis, Fourth Edition) .
How can you analyze these data as linear regression? Put all the values into the Y column. Let the X column represent group, with X=0 denoting group A, and X=1 denoting group B. Here is the linear regression analysis:
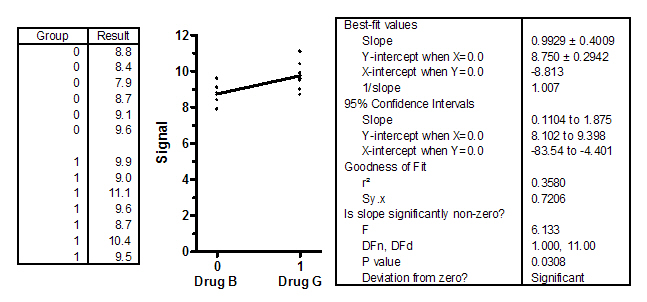
Compare the two analyses:
- The slope of the best-fit line equals the change in Y (difference between means) divided by the change in X. Since the groups are denoted by X=0 and X=1, that difference is 1.0, so the slope equals the difference between means.
- The confidence interval of the slope is identical to the confidence interval for the difference between means reported by the t test.
- Linear regression produces a P value testing whether the slope differs from zero. It is is the same as the P value from a t test asking if the means differ from each other.
In all respects, this is the same analysis as a t test, with the same assumptions and same results. So what does the R2 mean? It quantifies the fraction of all the variation in the samples that is explained by a difference between the group means. In this example, R2=0.36. Thus, 36% (a bit more than a third) of all the variation among values is explained by differences between the two group means, leaving 64% of the variation that comes from scatter among values within the groups.
If the two groups have the same mean, then none of the variation between values would be due to differences in group means so R2 would equal zero. If the difference between group means is huge compared the scatter within the group, then almost all the variation among values would be due to group differences, and the R2 would be close to 1.0.
If you have t test results from a program that doesn't calculate R2, use this shortcut formula to easily compute it: R2= t2/(t2 + df). For this example, that would be 2.4762/ ( 2.4762 + 11), which equals 0.358.
Of all the variation among the values, 36% is explained by the difference between the two drugs, leaving only 64% being random variation.
The value that Prism reports as R2 is also called eta squared.
R2 for unpaired t test computed by comparing the fits of two models
The null hypothesis is that both sets of data are sampled from populations with the same mean.
The alternative hypothesis is that the two populations have distinct means.
To compare models, we need to compute the sum-of-squares (SS) of both models.
To compute the SS for the null hypothesis, compute the difference between each value and the grand mean, and sum the square of those differences. This is actually an ingredient to compute the SD. So take the SD of all of the values (0.861) square it and multiply by the sample size minus 1. The SS for all data points equals 8.90.
To compute the SS for the alternative hypotesis, compute the difference between each value and its sample mean, and sum the square of all those differences (for both groups). The shortcut is to take each sample standard deviations, square and multiply by its sample size minus 1. Sum those values for both groups. SS = 5.71.
R2 is computed as 1-SSalt/SSnull = 0.358. This is of course the same value obtained by linear regression.
R2 for paired t test computed by comparing the fits of two models
Prism, unlike most statistics programs, reports a R2 value as part of the paired t test results. Other programs and books call this partial eta squared.
Here are the sample data obtained from Prism's welcome dialog analyzed with a paired t test.
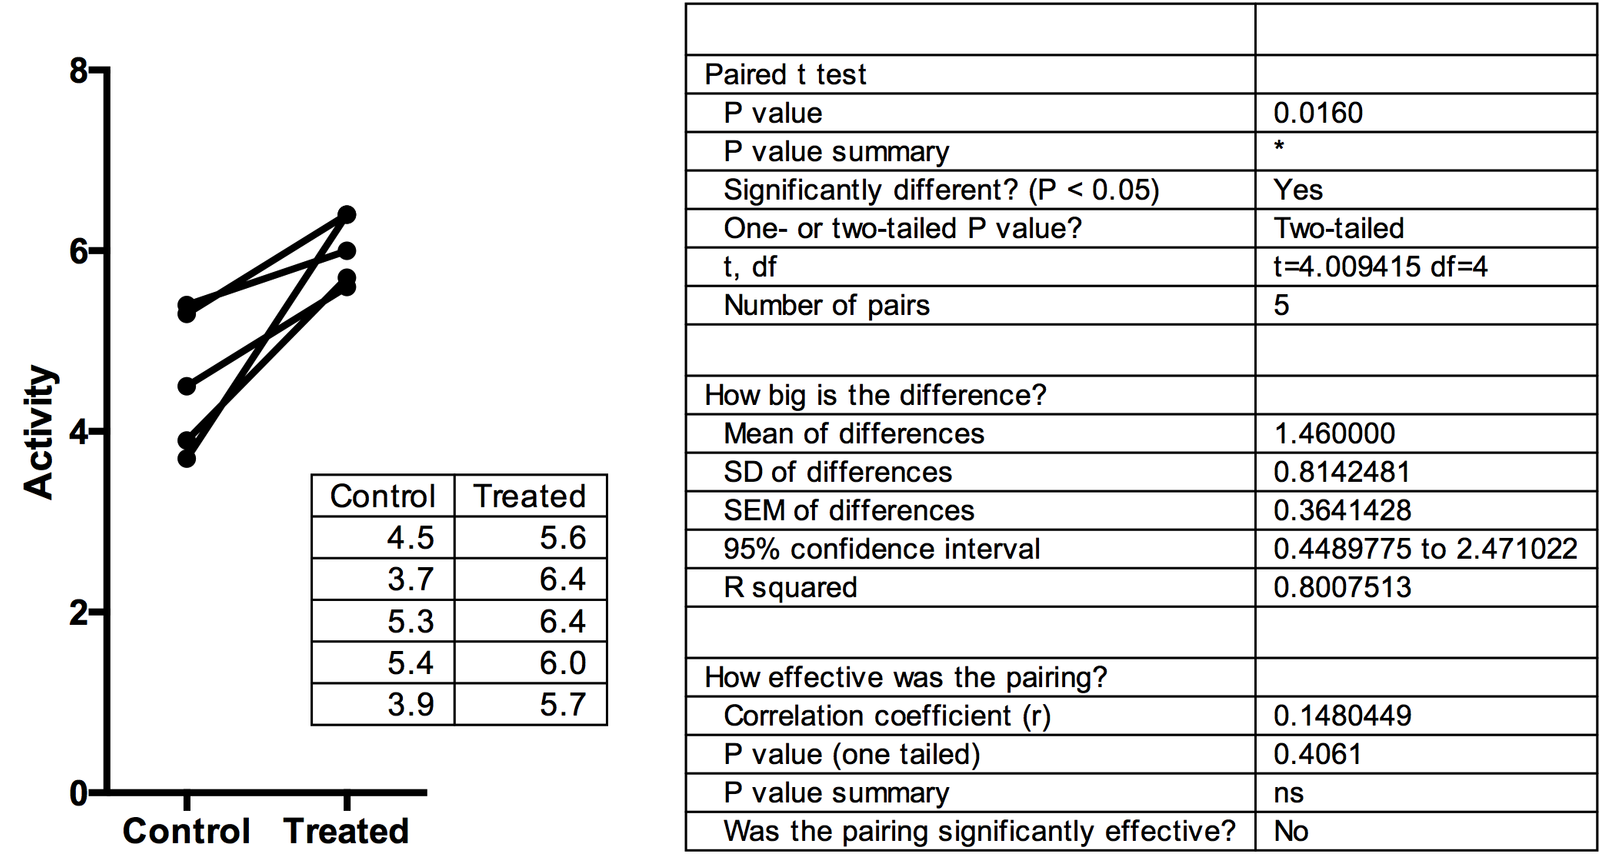
To compute the paired t test, the first step is to compute the difference (usually after-before) for each pair.
The null hypothesis is that that set of differences is sampled from a population whose mean is zero.
The alternative hypothesis is that the set of differences is sampled from a population whose mean is not zero.
The sum-of-squares (SS) for the null hypothesis is the sum of each difference squared. Or you can think of it as subtracting from each difference the null hypothesis, which is zero. SS = 13.31
The SS for the alternative hypothesis is the sum of squares of the difference between each paired difference and the average difference. The easiest way to compute this is as the square of the SD of the differences times 4 (one minus number of pairs) = 2.652.
R2 is computed as 1-SSalt/SSnull = 0.8008. Of all the variation among the differences between pairs, 80% is explained by the difference between the two groups, leaving only 20% being random variation.
This value, which Prism reports as R2, is also called partial eta squared, abbreviated  . This is different than eta squared, and different than omega squared. All are ways of quantifying effect size (Lakens, 2013). The distinction between eta squared and partial eta squared applies only to paired (or other repeated measures) designs.
Note that Prism also reports the correlation coefficient to quantify how tightly the before and after values are correlated. The value r is not related to the value of R2 (partial eta squared) that Prism reports.
1. Lakens, D. Calculating and reporting effect sizes to facilitate cumulative science: a practical primer for t-tests and ANOVAs. Frontiers in psychology 4, (2013).
Keywords: unpaired t, paired t, r square, r squared