Do the initial parameter values define a curve near the data?
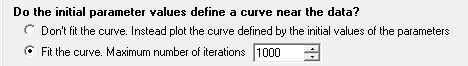
Nonlinear regression works iteratively, and begins with initial values for each parameter. Check "don't fit the curve" to see the curve generated by your initial values. If the curve is far from the data, go back to the initial parameters tab and enter better values for the initial values. Repeat until the curve is near the points. Then go back to the Diagnostics tab and check "Fit the curve". This is often the best way to diagnose problems with nonlinear regression.
While fitting a curve, Prism will stop after the maximum number of iterations set here. If you are running a script to automatically analyze many data tables, you might want to lower the maximum number of iterations so Prism won't waste time trying to fit impossible data.
How to quantify the standard deviation of the residuals?
The standard way to report the standard deviation of the residuals is with the Sy.x also called Se. Prism can also report the root mean square error, but we don't recommend it. How do the values differ?
How to quantify goodness-of-fit.

R2 and Adjusted R2
You will probably want to ask Prism to report R2, simply because it is standard to do so, even though knowing R2 doesn't really help you interpret the results. Reporting the sum-of-squares and sy.x will only be useful if you want to compare Prism's results to those of another program, or you want to do additional calculations by hand.
The adjusted R2 takes into account the number of parameters fit to the data, so has a lower value than R2 (unless you fit only one parameter, in which case R2 and adjusted R2 are identical). It is not commonly reported with nonlinear regression.
How to quantify the standard deviation of the residuals?
The standard way to report the standard deviation of the residuals is with the Sy.x also called Se. Prism can also report the root mean square error, but we don't recommend it. How do the values
AICc
Prism also lets you choose to report the AICc. This would be useful only if you separately fit the same data to three or more models. You can then use the AICc to choose between them. But note that it only makes sense to compare AICc between fits, when the only difference is the model you chose. If the data or weighting are not identical between fits, then any comparison of AICc values would be meaningless.
Residual tests. Are the residuals Gaussian with appropriate weighting?

Least-squares nonlinear regression assumes that the distribution of residuals follows a Gaussian distribution (robust nonlinear regression does not make this assumption). Prism can test this assumption by running a normality test on the residuals. Prism offers three normality tests. We recommend the D'Agostino-Pearson test.
Nonlinear regression assumes that, on average, the distance of the points from the curve is the same all the way along the curve, or that you have accounted for systematic differences by choosing an appropriate weighting. Prism can test this assumption with a test for appropriate weighting. If you have chosen equal weighting (the default) this is the same as a test for homoscedasticity.
Does the curve systematically deviate from the points?

Does the curve follow the trend of the data? Or does the curve systematically deviate from the trend of the data? Prism offers two tests that answer these questions.
If you have entered replicate Y values, choose the replicates test to find out if the points are 'too far' from the curve (compared to the scatter among replicates). If the P value is small, conclude that the curve does not come close enough to the data.
The runs test is available if you entered single Y values (no replicates) or chose to fit only the means rather than individual replicates (weighting tab). A 'run' is a series of consecutive points on the same side of the curve. If there are too few runs, it means the curve is not following the trend of the data. If you fit several curves at once, sharing one or more parameters (but not all the parameters) with global regression, Prism will report the runs test for each curve fit, but not for the global fit. Prior versions of Prism reported the overall runs test for the global fit, by summing the runs for each component curve, but this is not standard and Prism 7 does not report this.
If you choose a residual plot, Prism creates a new graph. The X axis is the same as the graph of the data, while the Y axis plots the distance of each point from the curve (the residuals). Points with positive residuals are above the curve; points with negative residuals are below the curve. Viewing a residual plot can help you assess whether the distribution of residuals is random above and below the curve.
Are the parameters intertwined or redundant or skewed?

What does it mean for parameters to be intertwined? After fitting a model, change the value of one parameter but leave the others alone. The curve moves away from the points. Now, try to bring the curve back so it is close to the points by changing the other parameter(s). If you can bring the curve closer to the points, the parameters are intertwined. If you can bring the curve back to its original position, then the parameters are redundant. In this case, Prism will alert you by labeling the fit 'ambiguous'.
We suggest that you report the dependency, and not bother with the covariance matrix. When you are getting started with curve fitting, it is OK to leave both options unchecked.
Even though nonlinear regression, as its name implies, is designed to fit nonlinear models, some of the inferences actually assume that some aspects of the model are close to linear, so that the distribution of each parameter is symmetrical. This means that if you analyzed many data sets sampled from the same system, the distribution of the best-fit values of the parameter would be symmetrical and Gaussian.
If the distribution of a parameter is highly skewed, the reported SE and CI for that parameter will not be very useful ways of assessing precision. Hougaard's measure of skewness quantifies how skewed each parameter is.
Could outliers impact the results?

Nonlinear regression is based on the assumption that the scatter of data around the ideal curve follows a Gaussian distribution. The presence of one or a few outliers (points much further from the curve than the rest) can overwhelm the least-squares calculations and lead to misleading results.
Check this option to count the outliers, but leave them in the calculations. Choose how aggressively to define outliers by adjusting the ROUT coefficient.
If you chose the option in the Fit tab to exclude outliers from the calculations, then this option to simply count outliers (in the Diagnostics tab) is not available.
Would it help to use stricter convergence criteria?

Nonlinear regression is an iterative process. It starts with initial values of the parameters, and then repeatedly changes those values to increase the goodness-of-fit. Regression stops when changing the values of the parameters makes a trivial change in the goodness of fit.
Prism lets you define the convergence criteria in three ways.
•Quick. If you are fitting huge data sets, you can speed up the fit by using the 'quick' definition of convergence. With this choice, nonlinear regression is defined to converge when two iterations in a row change the sum-of-squares by less than 0.01%.
•Medium (default). Nonlinear regression is defined to converge when five iterations in a row change the sum-of-squares by less than 0.0001%.
•Strict. If you are having trouble getting a reasonable fit, you might want to try the stricter definition of convergence. With this choice, the nonlinear regression iterations don't stop until five iterations in a row change the sum-of-squares by less than 0.00000001%. It won't help very often, but is worth a try. The only reason not to always use the strictest choice is that it takes longer for the calculations to complete. That won't matter with small data sets, but will matter with large data sets or when you run scripts to analyze many data tables.
If you check the option to automatically switch to strict convergence when needed, Prism will switch to the strict criteria when the R2 using the quick or medium criterion would have been 0.40 or less. This option might help Prism move past a false minimum in rare cases.