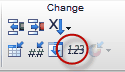
Excluding values from data tables If a value is too high or too low to be believable, you can exclude it. Excluded values are shown in blue italics on the data table, but are not included in analyses and are not shown on graphs. From the point of view of analyses and graphs, it is the same as if you had deleted the value, but the number remains on the data table to document its value. To exclude selected values, Click the Exclude button from the Change toolbar.
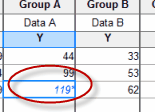
The excluded values appear in blue italics, followed by an asterisk.
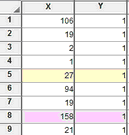
Choose on the File & Printer tab of the Preferences dialog how excluded values should appear when copied to the clipboard. Your choices are to copy a blank value (as if missing), a regular number (ignoring the fact that the value is excluded) or a value followed by an asterisk (to match what you see). Prism offers the same choices on the Export dialog to control how excluded values are exported to .TXT or .CSV files. Instead of manually choosing points to exclude, you can ask Prism to perform outlier elimination. Highlighting values Select a cell or a range of cells. Then click the paint bucket icon in the Change part of the toolbar, or drop Change and choose Cell Background Color. You can choose from eight colors to mark values that you want to double check, or to color code different aspects of an experiment.
Don't confuse highlighting cells in a data (or results) table from highlighting sheet names in the navigator.
|