
Graph tip: Create a spaghetti graph.
Spaghetti graphs plot longitudinal data, showing individual tracings for each subject (or other experimental unit).
Prism offers two ways to make a spaghetti graph.
Approach 1. One subject per data set
1. Enter data into an XY data table formatted with no subcolumns. Optionally enter subject identifies into the column titles.
2. In the Format Graph dialog, choose to not plot symbols, but to plot connecting lines.
3. Apply a color scheme, or use the Format Graph dialog, to assign each line a separate color.
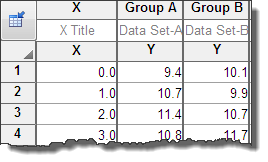
Approach 2. One group of subjects per data set (in subcolumns).
1. Enter data into an XY data table, formatted with subcolumns for replicates.

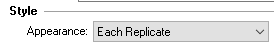
2. In the Format Graph dialog:
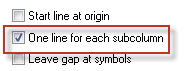
- Choose to plot Each Replicate at the top of the dialog.
- In Prism 6, check the option "One line for each subcolumn".

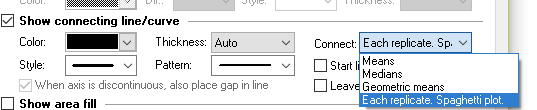
- In Prism 7, choose to connect "Each replicate, Spaghetti plot".


With this approach (#2), all subjects in one data set will appear in the same color. But if you have data in several data sets, each can have a different color. With approach #1, each subject (each tracing in the graph) can have its own color.