
The sum of two Gaussian distributions is not always bimodal.
Is the distribution of height bimodal? It depends on who you include.
If you include men and women, most people expect to see a bimodal distribution. Let's find out. The mean height of mean and women is 69.3 and 64.1 inches. Both are roughly Gaussian, with a standard deviation of about 2.85 inches. Using Prism, I simulated a sample of 100,000 men and 100,000 women from those populations, combined the samples, and created the this frequency distribution (Prism file).
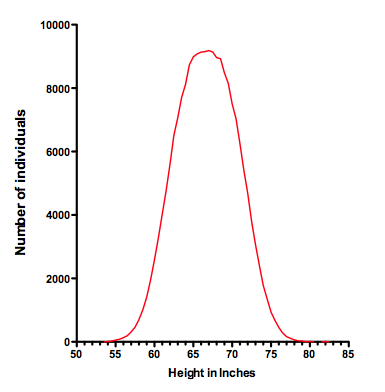
A bimodal distribution would have two humps like a camel. Not the case for height. In fact, Schilling and colleagues have shown that you won't see a bimodal shape when combining two Gaussian distributions unless the difference between the two means is greater than two times the standard deviation. In this example the difference between means (69.3 - 64.1 = 5.2 inches) is 1.82 times the standard deviation, not enough to create a bimodal distribution.
The distribution looks bell shaped, but it is does not have a Gaussian shape. The left graph below shows Prism's attempt to fit a Gaussian distribution to the data. The best-fit curve deviates (blue) substantially and systematically from the data (red). Looking at that fit is enough to convince you that the data do not form a Gaussian distribuiton. In contrast, the graph on the right is Prism's best-fit of a model that sums two Gaussian distributions (built-in to Prism, but I had to tweak the initial values to get it to fit). This fits the data perfectly. The graph may not have two modes, but the data are sampled from the sum of two Gaussian distributions.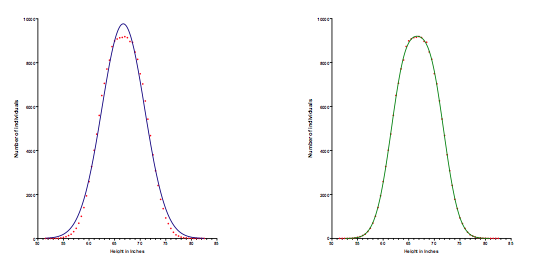
Reference: Schilling et al. Is human height bimodal?. The American Statistician (2002) vol. 56 (3) pp. 223-229.