
Relative vs. absolute IC50
The difference between the relative and absolute IC50
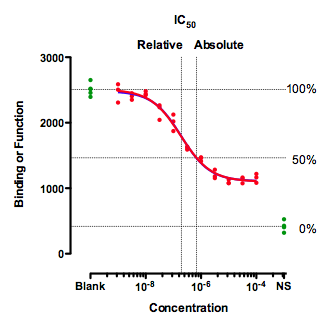
This figure (from a longer article on IC50 values) shows a situation where the IC50 can be defined two ways.
Clearly, a single value cannot summarize such a curve. You'd need at least two values, one to quantify the middle of the curve (the drug's potency) and one to quantify how low it gets (the drug's maximum effect).
The middle of the curve, the IC50, can be ambiguous as is sometimes defined in two alternative ways:
Relative IC50
This is by far the most common definition, and is usually what people mean by "the IC50". It is the concentration required to bring the curve down to point halfway between the top and bottom plateaus of the curve. This definition is the one upon which classical pharmacological analysis of agonist and antagonist interactions is based. With appropriate consideration of the biological system and concentrations of interacting ligands, estimated Kd values can often be derived from the IC50 value defined this way.
Unless the data are normalized to run from 0 to 100, the relative IC50 is not the value that corresponds to 50% on the right Y axis.
Absolute IC50.
The concentration that provokes a response halfway between the Blank and the NS value is sometimes called the absolute IC50, The horizontal dotted lines show how 100% and 0% are defined, which then defines 50%. This term is not entirely standard. Since this value does not quantify the potency of a drug, the authors of the International Union of Pharmacology Committee on Receptor Nomenclature think that the concept of absolute IC50 (and that term) is not useful in most situations (R. Neubig, personal communication). This term is not very standard, and is a bit misleading as there is nothing absolute about an "absolute EC50".
The concept (but not the term "absolute IC50") is used to quantify drugs that slow cell growth. The abbreviation GI50 is used for what we call here the absolute IC50. It is the concentration that results in inhibiting cell growth by 50%.
It is also used by the Environmental Protection Agency (EPA) in evaluating endocrine disrupters (Appendix A). That document uses the term IC50 to refer to the absolute IC50, and the term EC50 to refer to the relative IC50. It doesn't use the terms relative and absolute.
The absolute IC50 requires that the inhibitor brings the binding or response down to less than 50%. If the inhibitor only brings the response down to (say) 60%, then the curve never crosses the Y=50% line, so the absolute IC50 is undefined.
When are the relative and absolute IC50s the same?
The relative and absolute IC50 values are the same when the curve descends to a Y value of 0. In many cases, you have reliable control data to define 0. In other cases, 0 is defined in a logical way. For experiments where Y is the rate of cell growth, then if you inhibit cell growth completely, Y will be 0. In these kinds of experiments, the concentration that gives a Y value of 50% of maximum is called the GI50, for Growth Inhibition 50%. If high concentrations of drug completely stop cell growth, the value of the GI50 is identical to the relative IC50 and identical to the absolute IC50.
Fitting a dose-response curve to find the absolute IC50
If you find the concept of an absolute IC50 to be useful for your work, it is not hard to fit a curve to determine it. Appendix A of this EPA document, give the needed equation (which I have generalized a bit, so not require that the data already be normalized).
Y= Bottom + (Top-Bottom)/(1+10^((LogAbsoluteIC50-X)*HillSlope + log((Top-Bottom)/(Fifty-Bottom)-1)))
Note the distinction between the parameter Bottom and Baseline. Bottom is the Y value of the bottom plateau of the curve itself. Baseline is the Y value that defines 0% -- maximal inhibition by a standard drug. You'll definitely want to constrain Baseline to be a constant value based on controls. You may also want to constrain Top.
If you have already normalized your data so the curve starts at 100 and the baseline is 0, the equation can be simplified:
Download a Prism file with example data using both forms of the equation. When fitting data to the first from of the equation, don't forget to constrain Baseline and Top to appropriate values determined by controls. Additionally, this file contains another graph where the data are already normalized to run from 0 to 100%. These data are fit to a simpler equation where Baseline is set to equal zero, and Top is set to equal 100. These are hard-wired into the equation, so you don't have to remember to constrain those two parameters to constant values.