
The runs test
The runs test asks whether the curve fit by nonlinear regression (or the line fit by linear regression) deviates systematically from your data.
If you have fit the wrong curve entirely, then points will tend to cluster above and below that curve, and the runs test will report a small P value. This test is also called the Wald runs test for randomness.
Runs test in GraphPad Prism
Check an option in the Diagnostics tab of the nonlinear regression dialog, or on the linear regression dialog.
The runs test is useful only if you entered single Y values (no replicates) or chose to fit only the means rather than individual Y replicates (weighting tab). If you entered and analyzed replicate data, use the replicates test instead. The replicates test is only offered as part of nonlinear regression, but you can use that analysis to fit a straight line.
What is a run?
A run is a series of consecutive points that are either all above or all below the regression curve. Another way of saying this is that a run is a consecutive series of points whose residuals are either all positive or all negative. After fitting a curve, Prism counts the actual number of runs and calculates the predicted number of runs (based on number of data points). The runs test compares these two values.
Interpreting the P value from a runs test
The P value answers this question:
If the data are randomly scattered above and below the curve, what is the probability of observing as few runs (or even fewer) than actually observed in this analysis?
If the runs test reports a low P value, conclude that the curve doesn't describe the data very well. The problem might be that some of the errors are not independent, that outliers are mucking up the fit, or that you picked the wrong model.
Note that the P value is one-tailed. If you observed more runs than expected, the P value will be higher than 0.50.
Example
When you look at the fit of the curve to the points, it doesn't look right. In fact, the curve is constrained to have a Hill slope of 1.0, but the data were simulated using a Hill slope of 0.7.
The runs test quantifies the problem. There are only 4 runs. With so many points, the chance of having four or fewer runs is only 0.0021 or 0.21%. With such a small P value, we conclude that the model fit to the data is incorrect -- that the data are following a different model.
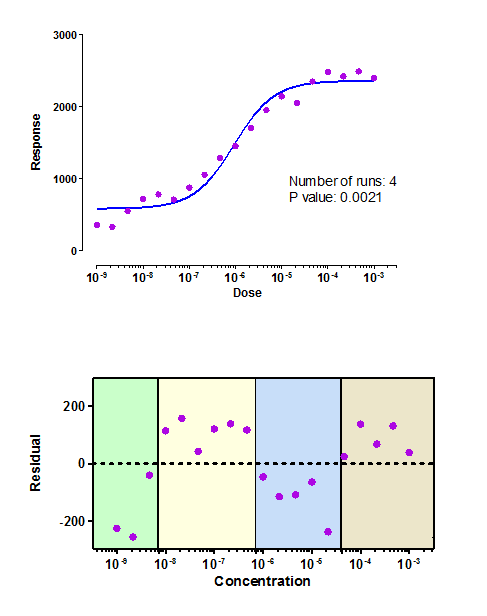
The residual plot makes this more clear. Each residual is the distance of a point from the curve. A run is a consecutive series of points with residuals that are all positive or all negative. I color coded the residual plot to show the four groups of points defining the four runs. If the correct model had been chosen, you would expect the points to be less clustered together on the residual plot and therefore you'd expect more runs.
How the runs test works
If the data points are randomly distributed above and below the regression curve, it is possible to calculate the expected number of runs. If there are Na points above the curve and Nb points below the curve, the number of runs you expect to see equals [(2NaNb)/(Na+Nb)]+1.
The P value is computed from the number of runs and the number of points. The details of the calculation are shown in Wikipedia, and on the top of this page from SAS.