
Example of a Monte Carlo analysis with Prism 6: Power of t test
Monte Carlo analyses let you simulate many data sets, analyze each, and look at how these analyses vary. Monte Carlo analyses can be very useful in exploring alternative experimental designs.
Example
This example will explore the power of an unpaired t test. The goal of this example, however, is broader -- to show how easy it is to perform Monte Carlo analyses with Prism 6 and to show you how useful they can be.
The question here is this: Given a certain experimental design and assumptions about random scatter, what is the chance (power) that an unpaired t test will give a P value less than 0.05 and thus be declared statistically significant.
Step 1. Simulating the first experiment
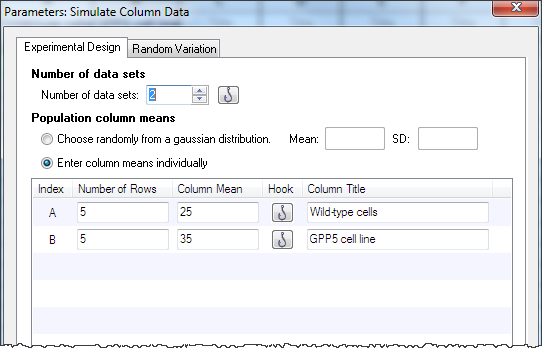
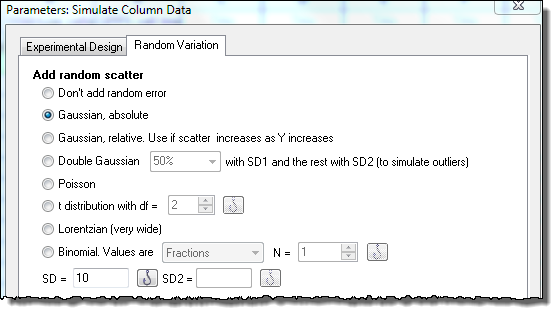
From any where, click New..Analysis and choose Simulate Column Data. Choose to simulate two groups, with five values per group, sampled from populations with means of 25 and 35 distributed according to a Gaussian distribution with a SD of 10.
 |
 |
Step 2. Analyze the data with a t test
From the simulated data table, click Analyze and choose t test from the list of Column analyses. Accept all the default choices to perform an unpaired t test, reporting a two-tail P value.
Step 3. View a few simulated results
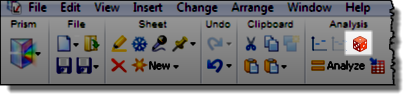
Copy the P value from the results and paste onto a graph of the data. It will paste with a live link, so the P value will change if the values change. To simulate a new set of data, click the red die icon, from the graph or results.
I put four of these graphs onto a layout. In each case, I double clicked on the graph (on the layout) and chose (on the first tab of Place Graph on Layout) to make the graph an unlinked picture that will not update when the graph changes. Even though there is only one graph in the project, I was able to put four different versions of it (with different random data) onto the layout.
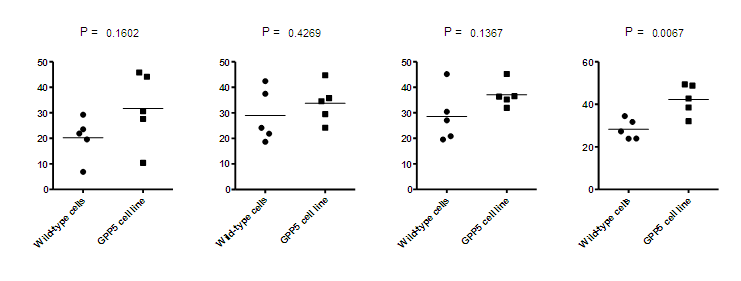
You can see that with random variation of the data, the P value varies a lot.
Step 4. Monte Carlo simulation
Start from the t test result, click Analyze and choose Monte Carlo simulation.
 ≈ ≈ |
.png) |
 |
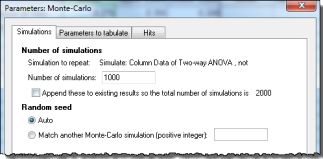
On the first (Simulations) tab, choose how many simulations you want Prism to perform. When just playing around, it might make sense to use as few as 100 simulations so you can see the results instantly. When trying to polish simulation results, it can make sense to use 10,000 or 100,000 simulations. A good compromise is 1000, which we select for this example.
On the second (Parameters to tabulate) tab, choose which parameters you want to tabulate. The choice is the list of analysis constants that Prism creates when it analyzes the data. For this example, we only want to tabulate the P value (from the t test which compares means; don't mix it up with the P value from the F test which compares variances).
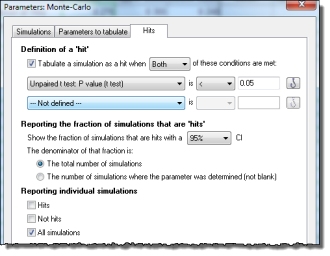
On the third (Hits) tab, define a criterion which makes a given simulated results a "hit". For this example, we'll define a hit to mean statistical significance with P<0.05.
Click OK and Prism will run the simulations. Depending on the speed of your computer, it will take a few or a few dozen seconds.
Step 5. Monte-Carlo results
The results of the simulations are shown in two pages.
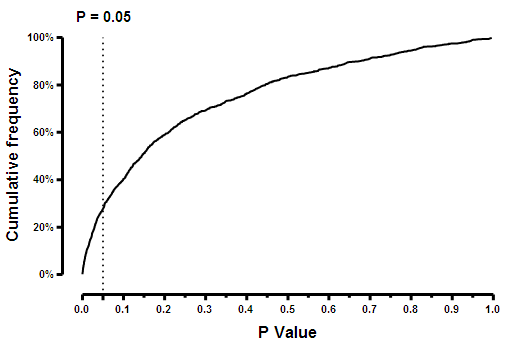
One shows the tabulated parameters for all simulations. In this example, we only asked to tabulate the P value, so this table is a list of 1000 (the number of simulations requested) P values. Note that at the bottom of the third (Hits) tab of the dialog, you can choose which tables you want to see -- only hits, only not hits, or all simulations. You can create a frequency distribution from this table. Click Analyze, and choose Frequency Distribution. You can see that about a quarter of the P values are less than 0.05.
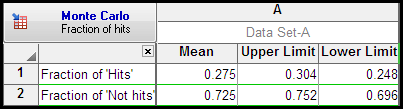
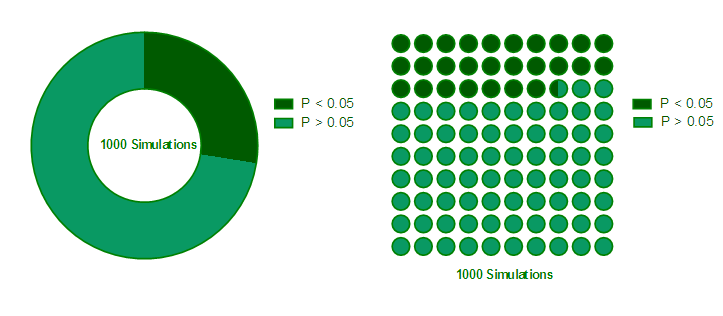
The other table summarizes the fraction of hits. For this set of simulations, 27.5% of the simulations were hits (P value less than 0.05), with a 95% confidence interval ranging from 24.8% to 30.4%. Another way of stating these results is that the power of our experimental design is 27.5%.
Note that the simulations depend on random number generation, which is initialized by the time of day you begin. So if you repeat this analysis, your results might not be identical each time.
If we had run more simulations, of course that confidence interval would be narrower.
From this table, click New...Graph of existing data to create a pie or percentage plot.
Perspective
Monte Carlo simulations are a very useful technique. Prism 6 makes it very easy, without any need for programming. This lets you test various experimental designs before spending lots of time and money on experiments. This particular example determined the power of an unpaired t test, something that is not hard to calculate directly. But Monte-Carlo simulations are very versatile, and can be used far beyond the situations for which power analysis is routine.