
How reproducible are P values? (not very)
P values are much less reproducible than you probably would guess.
If the null hypothesis is true, then the distribution of P values is uniform. Half the P values will be less than 0.50, 5% will be less than 0.05, etc. But what if the null hypothesis is false? Most people would expect the P values to be fairly reproducible in that case. Not so.
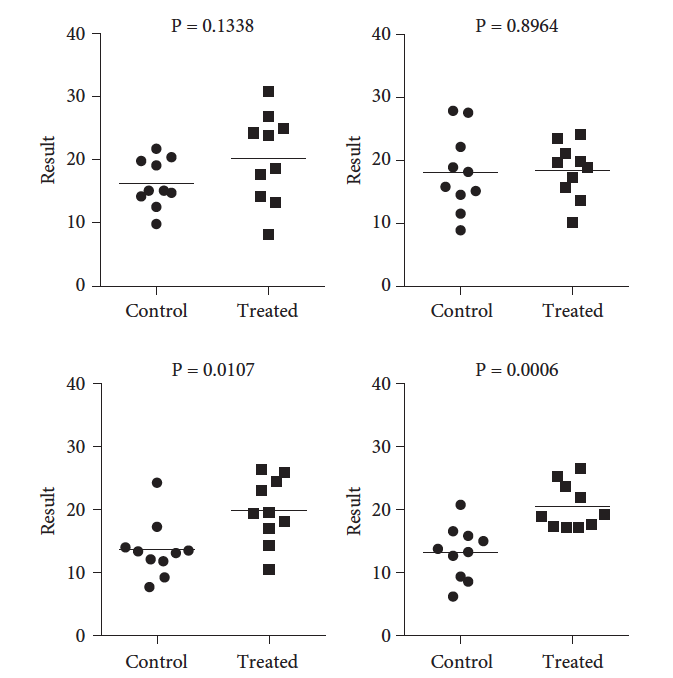
To demonstrate this, I ran some simulations using GraphPad Prism. I sampled from two Gaussian populations with the SD equal to 5.0. The two populations means differed by 5.0. Here are four simulated experiments. Only random sampling separates the four experiments. The four P values vary considerably.
And here is the distribution of P values from 2,500 such simulated experiments.
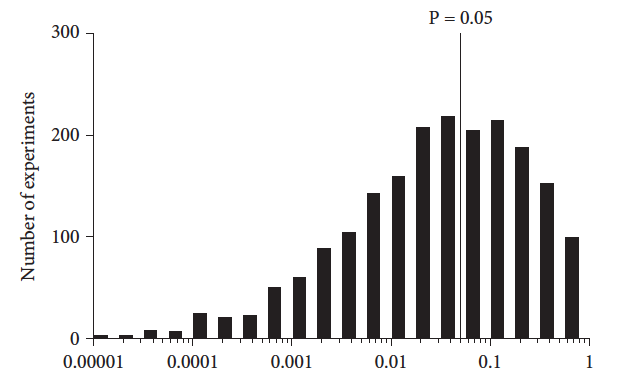
Leaving out the 2.5% highest and lowest P values, the middle 95% of the P values range from 0.0001517 to 0.6869—a range covering more than three orders of magnitude!
In these simulations, the median P value was about 0.05. I also ran simulations with a smaller SD which of course resulted in smaller P values, but the range still covered more than three orders of magnitude.
The idea for these simulations came from Boos and Stefanski (1) who demonstrated via simulations of a number of situations that P values from repeated simulated experiments vary over more than three orders of magnitude. Cumming (2) asked if the P value from one particular experiment equals 0.05, what the P value from a repeat experiment is likely to be (taking into account only random sampling and assuming there are no glitches with either experiment). Surprisingly, the results don’t depend on sample size. If the first P value equals 0.05, there is a 20% chance that the P value from a repeat experiment will be greater than 0.38 and a 5% chance it will be greater than 0.82.
There are many reasons to not rely on P values when analyzing data (here is one list; here is another). This page shows that beyond any conceptual reasons for avoiding P values is a very practical reason: P values are not very reproducible.
The figures above are Figure 15.1 from the third edition of Intuitive Biostatistics.
1. Boos, D. D. & Stefanski, L. A. P-Value Precision and Reproducibility. The American Statistician 65, 213–221 (2011).
2. Cumming, G. Replication and p Intervals: p Values Predict the Future Only Vaguely, but Confidence Intervals Do Much Better. Perspectives on Psychological Science 3, 286–300 (2008).