
Fixed bug: Incorrect exact P value computed by Spearman (nonparametric) correlation in Prism 6
When the bugs occurs
Bug 1. Huge samples with lots of ties
Prism up to 6.07 and 6.0g calculates the Rs and P for Spearman correlation incorrectly in cases where:
- You selected Spearman nonparametric correlation.
- Your sample size is huge.
- In either the X or Y column, there are more than 1290 identical (tied) values. The calculations to correct for ties overflowed, and so reported an incorrect answer, in this very rare case.
- Fixed in Prism 7.
Bug 2. Tiny samples with ties (fixed in 6.07 and 6.0g)
Prism 6 releases up to 6.05 and 6.0f calculate the P value for Spearman correlation incorrectly in cases where:
- You selected nonparametric Spearman correlation. Pearson correlation is fine.
- There are ties in the data. This means that two (or more) X values are the same, or two or more Y values are the same. Nonparametric correlation works by analyzing ranks. When two values are the same, they get the same rank. If there are no ties, the P value is fine.
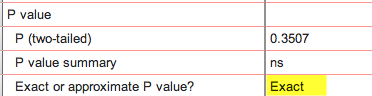
- The sample size (number of XY pairs) is 17 or smaller, small enough that Prism reports an exact P value. There is no bug when it reports an approximate P value. If you review your results, it is easy to tell if the calculation was approximate or exact.
Most programs don't attempt to compute an exact P value in the presence of ties. Like most other programs, Prism 5 and earlier reported an approximate P value when there were ties. With small sample sizes, Prism 6 does the extra work to compute an exact P value. But in some cases it did so incorrectly. The bug had the biggest impact with tiny sample sizes, or data sets with many ties. The bug was trivial when there is only one set of tied values and the sample size was not tiny.
How inaccurate were the reported P values?
Prism always reported Rs correctly. The bug only affects the reported value of the P values, and the discrepancy is tiny.
If you had 18 or more XY pairs
Prism computes an approximate, not exact, P value and there was no bug.
If there are no ties (no two X values are identical; no two Y values are identical)
Prism always computed the P values correctly when there are no ties.
If you had only 3 or 4 XY pairs
This is where the bug was the worst. The P value was reported incorrectly about two thirds of the time. With ties and so few XY pairs, there are fewer than 20 permutations of the data. That means the P value can never be less than 1/20 or 0.05. Yet Prism sometimes reported smaller P values. If Prism 6 (prior to 6.06 and 6.0g reported that a Spearman correlation was "statistically significant" (P < 0.05) with 3 or 4 XY pairs where there were two or more values identical (tied), that conclusion was wrong. The P value was actually greater than 0.05.
If there are ties in one variable and Rs is positive
No bug. The reported P values were correct.
If there are ties in one variable, and Rs is negative
In about half the cases, there is no bug. In the other half, the reported P value was smaller than the true P value. How much smaller? It depends on the number of XY pairs. This table shows the average discrepancy between the reported and true P value, and the chance that you would have mistakenly reported a result as "statistically significant" (P<0.05) when the true P value is greater than 0.05. This table (and the ones below) is based on 100,000 simulations (but not every possible combination), so the values are not exact.
| # XY Pairs | Average discrepancy | % incorrect "significant" designation |
| 5 | 0.08 | 65% |
| 8 | 0.02 | 6% |
| 14 | 0.006 | 4% |
If there are ties in both X and Y, and Rs is positive
In about two thirds of cases, the reported P value was smaller than the true P value. How much smaller? It depends on the number of XY pairs. This table is based on 100,000 simulations (but not every possible combination), so the values are not exact.
| # XY Pairs | % P values that are incorrect | Average discrepancy | % incorrect "significant" designation |
| 5 | 70% | 0.03 | (none in our simulations) |
| 8 | 63% | 0.001 | (none in our simulations) |
| 14 | 83% | 0.0001 | (none in our simulations) |
If there are ties in both X and Y, and Rs is negative
In most cases, the reported P value was incorrect. The discrepancy could be in either direction. This table is based on 100,000 simulations (but not every possible combination), so the values are not exact.
| # XY Pairs | % P values that are incorrect | Average discrepancy | % incorrect "significant" designation |
| 5 | 93% | 0.1 | 55% |
| 8 | 97% |
0.0001 (if too low) 0.02 (if too high) |
16% |
| 14 | 99% |
0.00001 (if too low) 0.01 (if too high) |
4% |
Workaround
When Prism displays the progress dialog showing the calculations, press Cancel. Prism will then show an approximate P value instead of an exact one. This approximate P value is what most other programs would display.
Fix
This bug is fixed in Prism 6.07 Windows and 6.0g Mac.
Explanation for bug
Why we made the mistake: When there are no ties, the distribution of Rs values for shuffled data sets is symmetrical and centered on Rs=0. We made the mistake of thinking this was also true in the presence of ties. But it isn't. If that fact surprises you, you'll understand how this bug occurred. This example demonstrates the asymmetry.
X values: 1, 2, 3, 3, 4
Y values: 2, 1, 2, 2, 2
Rs = 0.36
Spearman P value calculations work by leaving the X values alone, and scrambling the Y values in every possible rearrangement. When you do this, there are only four possible Rs values: 0.73, -0.18, 0.36, 0.73. The observed P value is 0.36, but notice that none of the permutations result has Rs =- 0.36. This proves that the distribution is (can be) asymmetrical.
This asymmetry means that the two tail P value is not twice the one tail P value. The one-tailed P value for the example above is 0.4, and the two-tailed P value is 0.6.
This problem is most apparent with the biggest discrepancies with tiny data sets.
Why didn't we detect the bug in testing? Because at the time we did this coding, we didn't know of any other program that computes exact P values in the presence of ties. Now we realize that the excellent program StatXact does so, and we have compared 500 examples. Prism 6.07 and 6.0d gives the same result as StatXact in all 500 cases.