
Fitting the ratio of two EC50 values.
Frequently the goal of a dose-response experiment is to quantify the change in an EC50 when a treatment is applied.
You can ask Prism to fit the two curves and report the two log(EC50) values. Then compute the ratio. But this won't give you the 95% confidence interval for the ratio. To do that, you need to rewrite the equations to make the difference in log(EC50) values to be one of the parameters that Prism fits.
The needed equation is built-in to Prism since version 5. It is called 'EC50 Shift' and is in the 'Dose-response -- special' list of equations.
If you use Prism 4, enter this user-defined equation:
<A>LogEC50=LogEC50Con
<B>LogEC50=LogEC50Con+ DeltaLogEC50
Y=Bottom + (Top-Bottom)/(1+10^((LogEC50-X)*HillSlope))
The bottom line defines the variable slope dose-response curve. The first line sets the log(EC50) for the first (control) data set to a parameter called "LogEC50Con". The second line sets the log(EC50) for the second data set to equal the logEC50 of the first data set plus a Delta.
In the constraints tab of nonlinear regression, set the bottom, top, HillSlope, and LogEC50Con to be shared. This is important. If the top, bottom and slope are not shared, then the curves differ in more than just the EC50 so the potency shift may not be a useful value.
Set the initial values of the Bottom to be 1*Ymin, the Top to be 1*Ymax, the logEC50Con to be 1*X at Ymid.
Here is an example fit with results.
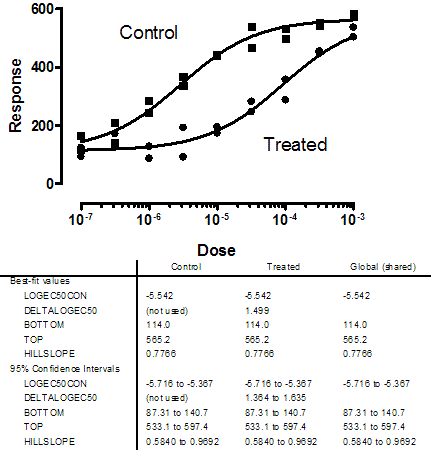
The best-fit value for the change in EC50s (the DeltaLogEC50) is 1.50 with a 95% confidence interval ranging from 1.28 to 1.64. This is the difference between the two logEC50s, which is equivalent to the log of the ratio of the two EC50s. Take the antilog of these values to convert to a ratio of logEC50s. So the ratio of EC50 values (the dose ratio) is 101.50 which equals 31.6. The 95% confidence interval ranges from to 19.05 to 43.65.
Keywords: dose ratio dose shift relative potency ec50 ratio potency ratio affinity ratio