
What is the meaning of * or ** or *** in reports of statistical significance from Prism or InStat?
Choose P value Format
Starting with Prism 8, Prism allows you to choose which decimal format Prism will use to report P values (information on previous versions of Prism can be found below). Each analysis that computes P values gives you four choices:
- APA (American Psychological Association) style, which shows three digits but omits the leading zero (.123). P values less than 0.001 shown as "< .001". All P values less than 0.001 are summarized with three asterisks, with no possibility of four asterisks.
- NEJM (New England Journal of Medicine) style, which shows three digits and includes the leading zero (0.123). P values less than 0.001 shown as "< .001". All P values less than 0.001 are summarized with three asterisks, with no possibility of four asterisks.
- GraphPad style which reports four digits after the decimal point with a leading zero (0.1234). P values less than 0.0001 shown as "< .0001". P values less than 0.001 are summarized with three asterisks, and P values less than 0.0001 are summarized with four asterisks.
- Choose how many digits you want to see after the decimal point, up to 15. P values less than 0.001 are given three asterisks, and P values less than 0.0001 are given four asterisks.
|
Symbol |
Meaning |
|
ns |
P > 0.05 |
|
* |
P ≤ 0.05 |
|
** |
P ≤ 0.01 |
|
*** |
P ≤ 0.001 |
|
**** |
P ≤ 0.0001 (For the last two choices only) |
Note that the first two choices (APA and NEJM) show at most three asterisks (***) and the last two choices will show four asterisks with tiny P values (****).
The multiple t test analysis is different than all the rest. In earlier versions of the software (Prism 6), the "Significant?" column would display a single asterisk if the t test for that row is statistically significant, given your setting for alpha and the correction for multiple comparisons. Prism would either places a single asterisk in that column or leaves it blank. It would never places more than one asterisk. In this column, current versions of Prism simply write "Yes" or "No" depending on if the test corresponding to that row was found to be statistically significant or not.
Note a possible misunderstanding. Prism 8.0-8.2 presents the choices for P value formatting like this:
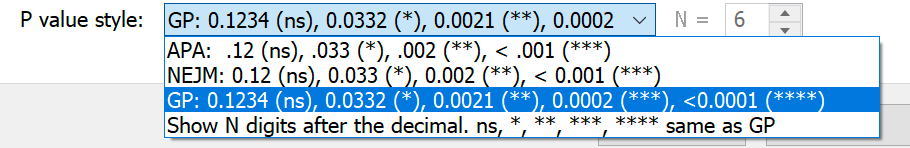
The P values shown are examples. It shows one P value presented as ".033", or as "0.033", or as "0.0332" depending on the choice you made (note the difference in the number of digits and presence or absence of a leading zero). Some people have misunderstood this to mean that we define a single asterisk to mean P<0.0332. But of course, we use the standard definition of <0.05. We'll find a way to make these choices less confusing in a future release.
Prism 6 and InStat 3
Prism 6 uses this convention:
| Symbol | Meaning |
| ns | P > 0.05 |
| * | P ≤ 0.05 |
| ** | P ≤ 0.01 |
| *** | P ≤ 0.001 |
| **** | P ≤ 0.0001 (see note) |
Up to three asterisks, this is fairly standard, but not completely, so you ought to state the scale in your figure legends or methods section. Four asterisks for tiny P values is not entirely standard.
Prism 5
Up until Prism 5.04 (Windows) and 5.0d (Mac), Prism never reported more than three asterisks. Any P value less than 0.001 was designated with three (***) asterisks.
With Prism 5.04 and 5.0d, P values between 0.0001 and 0.001 are shown with three asterisks, and P values less than 0.0001 are shown with four (****) asterisks.
<0.05 or <=0.05?
Prism has always used the less-than-or-equal-to inequality. Until May 2012, this page mistakenly said the cutoff was less-than...
Prism makes the decision on whether to display an asterisk (and how many asterisk to show) based on the full P value it computes in double precision (about 12 digits of precision), not the P value you see displayed. So if the P value is actually 0.0500001, Prism will display "0.0500" and label that comparison as "ns".
Keywords: asterisk asterisks stars star Michelin guide * or ** or *** star report