 |
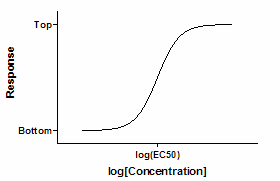 |
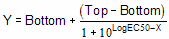
This is a general equation for a dose-response curve. It shows response as a function of the logarithm of concentration. X is the logarithm of agonist concentration and Y is the response. This equation is also called a three-parameter logistic equation.
The variable Bottom is the Y value at the bottom plateau; Top is the Y value at the top plateau, and LogEC50 is the X value when the response is halfway between Bottom and Top. LogEC50 is the logarithm of the EC50 (effective concentration, 50%). With different kinds of variables, this variable is sometimes called ED50 (effective dose, 50%), or IC50 (inhibitory concentration, 50%, used when the curve goes downhill).
This equation assumes a standard slope, where the response goes from 10% to 90% of maximal as X increases over about two log units. The next equation allows for a variable slope.