- Prism
FEATURES
Analyze, graph and present your workComprehensive analysis and statisticsElegant graphing and visualizationsShare, view and discuss your projectsLatest product features and releasesPOPULAR USE CASES
- Enterprise
- Resources
- Support
- Pricing
Resources
Explore our educational resources to advance your knowledge of Prism, statistics and data visualization
Getting Started
VIDEO SERIESGetting Started in Prism
Master the basics in Prism with these short video tutorials
VIDEO SERIESEssential Statistics in Prism
Start performing common types of analyses
VIDEO SERIESGraphing Basics in Prism
Learn how to customise graphs in Prism
VIDEO SERIESStatistics Bootcamp
Learn the fundamentals and perform better analyses
Advance Your Skills with Prism Academy
- 125+ videos and hours of learning material taught by highly-technical experts
- Improve accuracy interpreting and presenting your research
- Master the art of data visualization and presentation
- Become more efficient and productive using Prism

Popular Tutorials & Guides

GUIDESPrism User Guide
Guided examples of common analyses to get you started
GUIDEStatistics Guide
A concise guide to doing statistical analyses with Prism

GUIDECurve Fitting Guide
Master curve fitting basics and its effective use in Prism

VIDEO SERIESGetting Started in Prism
Master the basics in Prism with these video tutorials
Quick Calcs
Run statistical analyses quickly and directly in your browser

Fisher's, Chi square, McNemar's, Sign test, CI of proportion, NNT (number needed to treat), kappa.

Descriptive statistics, detect outlier, t test, CI of mean / difference / ratio / SD, multiple comparisons tests, linear regression.

Calculate P from t, z, r, F or chi-square, or vice-versa. View Binomial, Poisson or Gaussian distribution. Correct a P value for multiple comparisons and Bayes.

Assign subjects to groups, simulate data.

Create and convert molar solutions, convert moles & grams, radioactivity calculations.
Recommended Resources
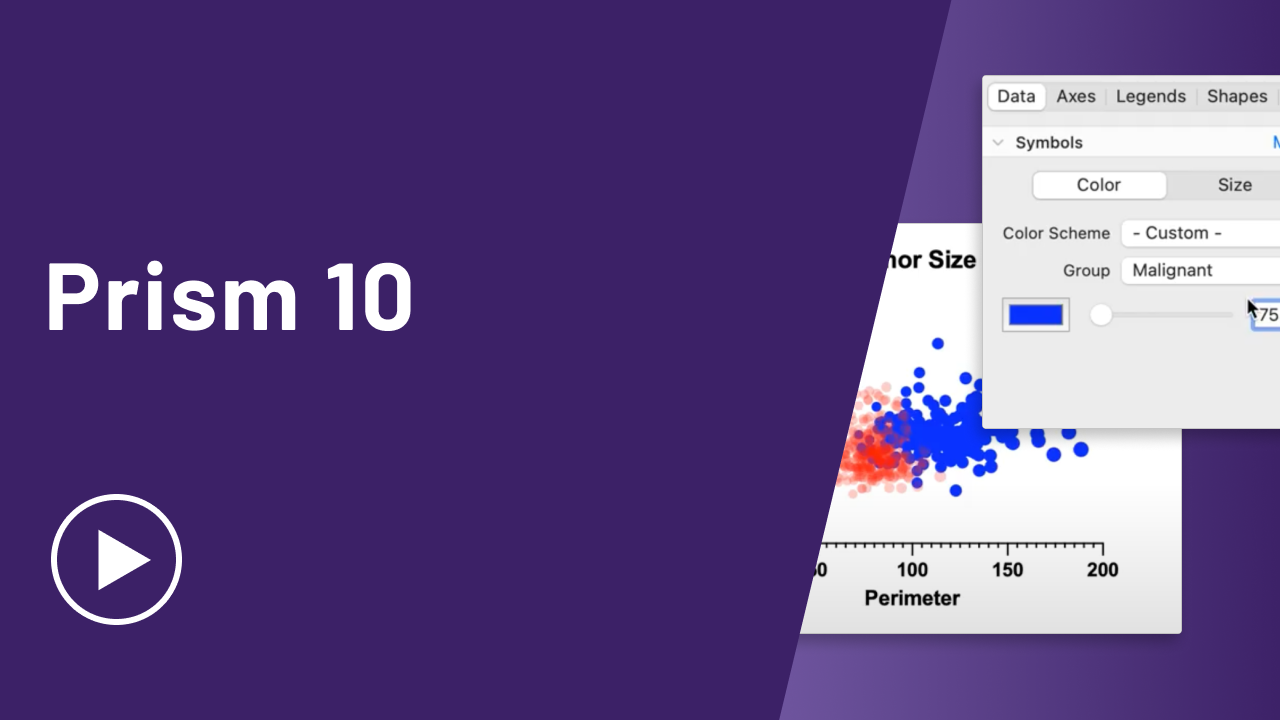
VIDEO SERIESDiscover Prism 10
Powerful data analysis, advanced graph customization and more

GUIDESPrism User Guide
Guided examples of common analyses to get you started

GUIDEStatistics Guide
A concise guide to doing statistical analyses with Prism

GUIDECurve Fitting Guide
Master curve fitting basics and its effective use in Prism

GUIDEUltimate Guide to ANOVA
Get all of your ANOVA questions answered here
GUIDEUltimate Guide to T Tests
Get all of your t test questions answered here

GUIDEUltimate Guide to Linear Regression
Get all your linear regression questions answered here

GUIDEUltimate Guide to Survival Analysis
Get all of your Survival Analysis questions answered here
Explore the Knowledgebase
Popular Articles
Analyze, graph and present your scientific work easily with GraphPad Prism. No coding required.


