This equation is used when X values are concentrations. Use a related equation when X values are logarithms of concentrations or doses.
Introduction
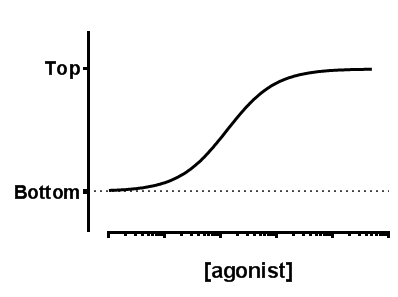
Many log(dose) response curves follow the familiar symmetrical sigmoidal shape. The goal is to determine the EC50 of the agonist - the concentration that provokes a response half way between the basal (Bottom) response and the maximal (Top) response.
Many dose-response curves have a standard slope of 1.0. This model does not assume a standard slope but rather fits the Hill Slope from the data, and so is called a Variable slope model. This is preferable when you have plenty of data points. It is also called a four-parameter dose-response curve, or four-parameter logistic curve, abbreviated 4PL.
Step by step
Create an XY data table. Enter the concentrations of the agonist into X. Enter response into Y in any convenient units. Enter one data set into column A, and use columns B, C... for different treatments, if needed.
From the data table, click Analyze, choose nonlinear regression, choose the panel of equations "Dose-response curves - Stimulation" and then choose the equation "[Agonist] vs. response -- Variable slope".
Consider constraining the parameter HillSlope to its standard values of 1.0. This is especially useful if you don't have many data points, and therefore cannot fit the slope very well.
If you have subtracted off any basal response, consider constraining Bottom to a constant value of 0.
Since the uncertainty of the EC50 is very asymmetric, be sure to choose to compute the confidence intervals using the likelihood ratio asymmetric method.
Double click on the X axis of the graph, and choose (at the upper left of the Format Graph dialog) to stretch the axis to a logarithmic scale.
Model
Y=Bottom + (X^Hillslope)*(Top-Bottom)/(X^HillSlope + EC50^HillSlope)
Interpret the parameters
EC50 is the concentration of agonist that gives a response half way between Bottom and Top. This is not the same as the response at Y=50. Depending on which units Y is expressed in, and the values of Bottom and Top, the EC50 may give a response nowhere near "50". Prism reports both the EC50 and its log.
HillSlope describes the steepness of the family of curves. A HillSlope of 1.0 is standard, and you should consider constraining the Hill Slope to a constant value of 1.0. A Hill slope greater than 1.0 is steeper, and a Hill slope less than 1.0 is shallower.
Top and Bottom are plateaus in the units of the Y axis.