Introduction
This equation describes the pseudo-first order association kinetics of the interaction between a ligand and its receptor, or a substrate and an enzyme. During each time interval a certain fraction of the unoccupied receptors become occupied. But as time advances, fewer receptors are unoccupied so fewer ligand bind and the curve levels off.
Entering data
Create an XY data table. Enter time into X, and response (binding, concentration ..) into Y. If you have several experimental conditions, place the first into column A, the second into column B, etc.
After entering data, click Analyze, choose nonlinear regression, choose the panel of exponential equations, and choose One phase association.
Consider constraining Plateau to a constant value of zero
If you have subtracted off any background signal, then you know the curve has to plateau at Y=0. In this case, you should constrain the parameter Plateau to be a constant value equal to zero. To do this, go to the Constrain tab of the nonlinear regression dialog, set the drop down next to Plateau to "Constant equal to" and enter the value 0.0.
Model
Y=Y0 + (Plateau-Y0)*(1-exp(-K*x))
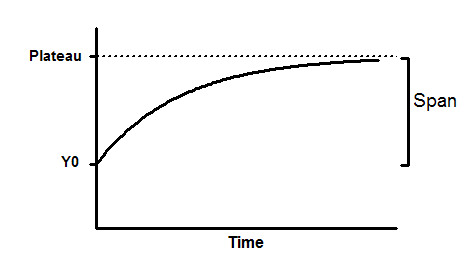
Y0 is the Y value when X (time) is zero. It is expressed in the same units as Y,
Plateau is the Y value at infinite times, expressed in the same units as Y.
K is the rate constant, expressed in reciprocal of the X axis time units. If X is in minutes, then K is expressed in inverse minutes.
Tau is the time constant, expressed in the same units as the X axis. It is computed as the reciprocal of K.
Half-time is in the time units of the X axis. It is computed as ln(2)/K.
Span is the difference between Y0 and Plateau, expressed in the same units as your Y values.