Introduction
An homologous binding experiment is one where the labeled and unlabeled ligands have identical affinities for the receptors. Generally this is because the two are chemically identical. Receptor number and affinity are determined by analyzing the competition of varying concentrations of unlabeled ligand for one (or better, two) concentrations of labeled ligand.
Step by step
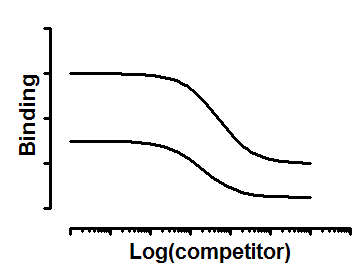
Create an XY data table. Enter the logarithm of the concentration of the unlabeled compound into X, and binding into Y. Enter the concentration of labeled ligand (in nM) as the column title. You will get better results if you use two different concentrations of labeled ligand.
If you have several experimental conditions, place the first into column A, the second into column B, etc. Use subcolumns to enter replicates.
From the data table, click Analyze, choose nonlinear regression, choose the panel of Competition Binding equations, and choose One site - Homologous.
Model
ColdNM=10^(x+9) ;Cold concentration in nM
KdNM=10^(logKD+9) ;Kd in nM
Y=(Bmax*HotnM)/(HotnM + ColdNM + KdNM) + Bottom
Interpret the parameters
logKd Log of the equilibrium binding constant. Since the analysis is based on the assumption that labeled and unlabeled ligand bind with identical affinities, the logKd applies to both forms of the ligand.
Bmax is the maximum binding of ligand to receptors in cpm. This represents binding to all the receptors so is higher than the top plateau of the curve.
NS is a measure of nonspecific binding. It is the bottom plateau in units of the Y axis divided by the concentration of the hot ligand in nM. In other words, it is the fraction of hot ligand that binds nonspecifically.
Prism fits the curves globally to find one shared value for logKd, Bmax and NS from all sets of data
Notes
This model assumes that the hot and cold ligand binds identically to the receptor, and that you use two concentrations of hot ligand (in column A, and B ..) and vary cold. It assumes that a small fraction of added ligand binds, so the free concentration is close to what you added.