1. Create a data table
From the Welcome or New Table dialog, choose to create an XY data table.
If you are just getting started, choose the sample data: Linear regression -- Interpolate from standard curve
If you are entering your own data, choose the subcolumn format. Choose replicate values if you have replicates to enter. Prism can plot error bars automatically. You can also choose to enter data where the mean and SD (or SEM) have already been calculated. In this case, if you want to take into account variations in the SD from point to point, use nonlinear regression to fit the line.
2. Enter data
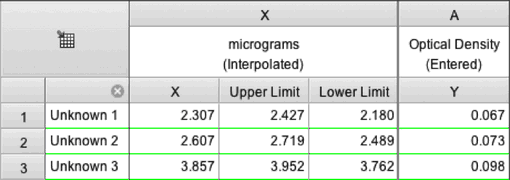
Enter the unknowns below the standards on the same table. Enter Y values with no X values in those rows (example below), or X values with no Y values in those rows. Optionally enter row titles to label those unknowns.

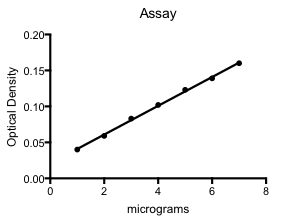
3. View the graph

4. Analysis choices
Click the Analyze button and from the list of XY analyses choose: Interpolate a Standard Curve.
Alternatively, you can click the “Interpolate a standard curve” button right on top of the Analyze button. 
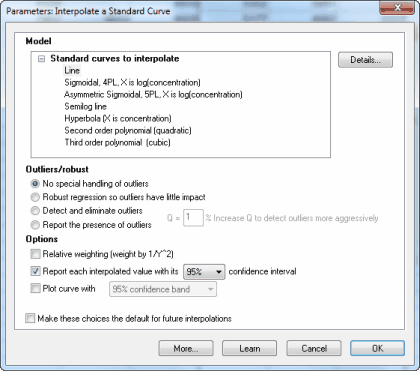
Choose Line in the list of Standard curves to interpolate. Unless you have a good reason, you can leave the other choices on that dialog set to their default values.
5. Inspect the results
View the graph with the superimposed line.
The results will appear in several pages, including one with the interpolated values, which will be in the same units as your original data.
The second page of results tabulates the best-fit values of the parameters and much more. For this example, we aren't too interested in these results.